TOTAL Marketcap / Crypto Total Market Cap
TOTAL weekly analysis Week 10é 2026. The TOTAL index is trading in a broad consolidation and our TOTAL weekly analysis continues to show heavy back-and-forth price action, where upside attempts keep meeting supply despite occasional bullish closes.
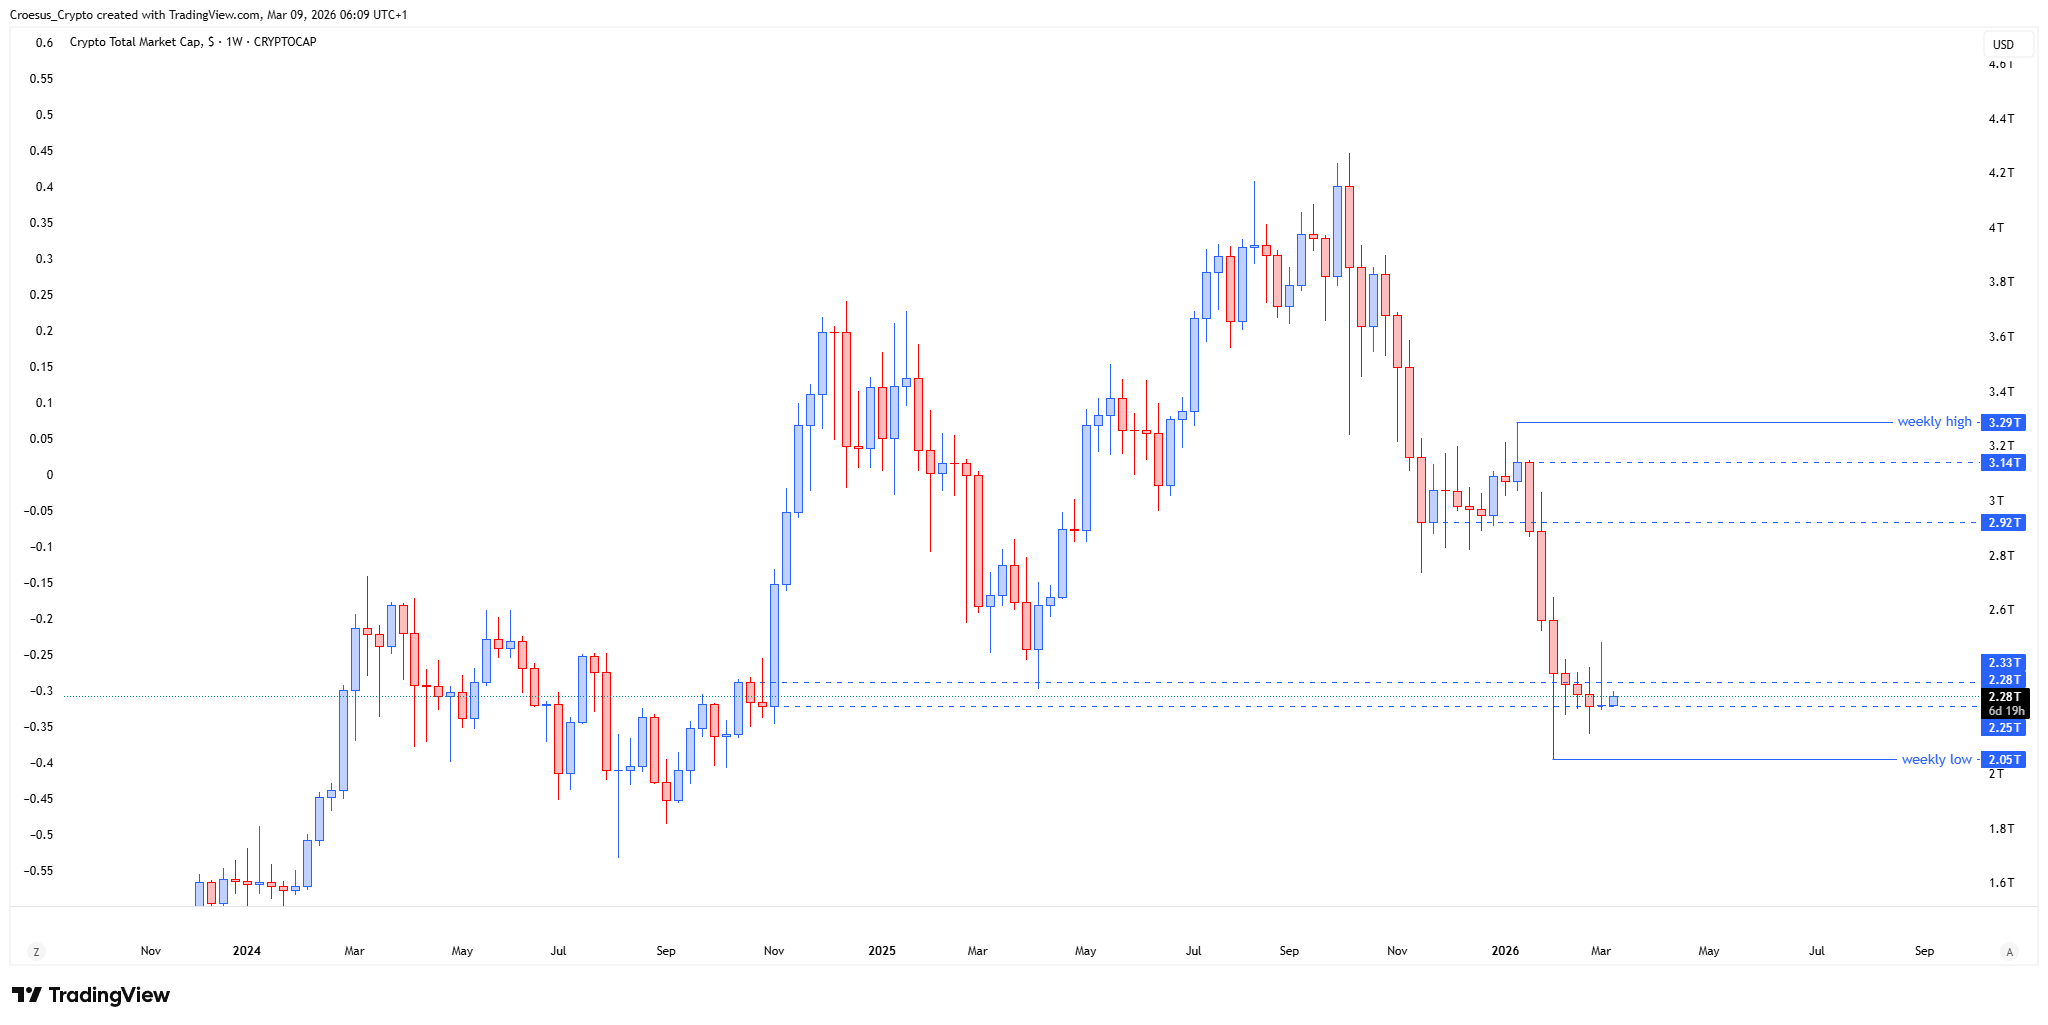
- The TOTAL index tried to push higher this week but failed and got rejected.
- We can see a large rejection wick but still closing bullish.
- The index is in a larger consolidation area, with a lot of support and resistance it needs to conquer and maintain.
Market Structure Analysis
Structurally, the rejection on a weekly push higher signals that the current rally leg is still corrective inside a larger range, rather than a clean impulsive breakout. Even though the candle closes bullish, the large upper wick shows aggressive selling into strength, which often marks a liquidity sweep above local swing levels followed by distribution back into the range.
This keeps the market in a “prove it” environment: buyers can defend closes, but they are not yet converting that strength into sustained progress above overhead resistance.
In practice, this TOTAL weekly analysis reads as choppy market structure with mixed order flow, where horizontal support resistance remains the dominant framework and follow-through becomes the key confirmation trigger.
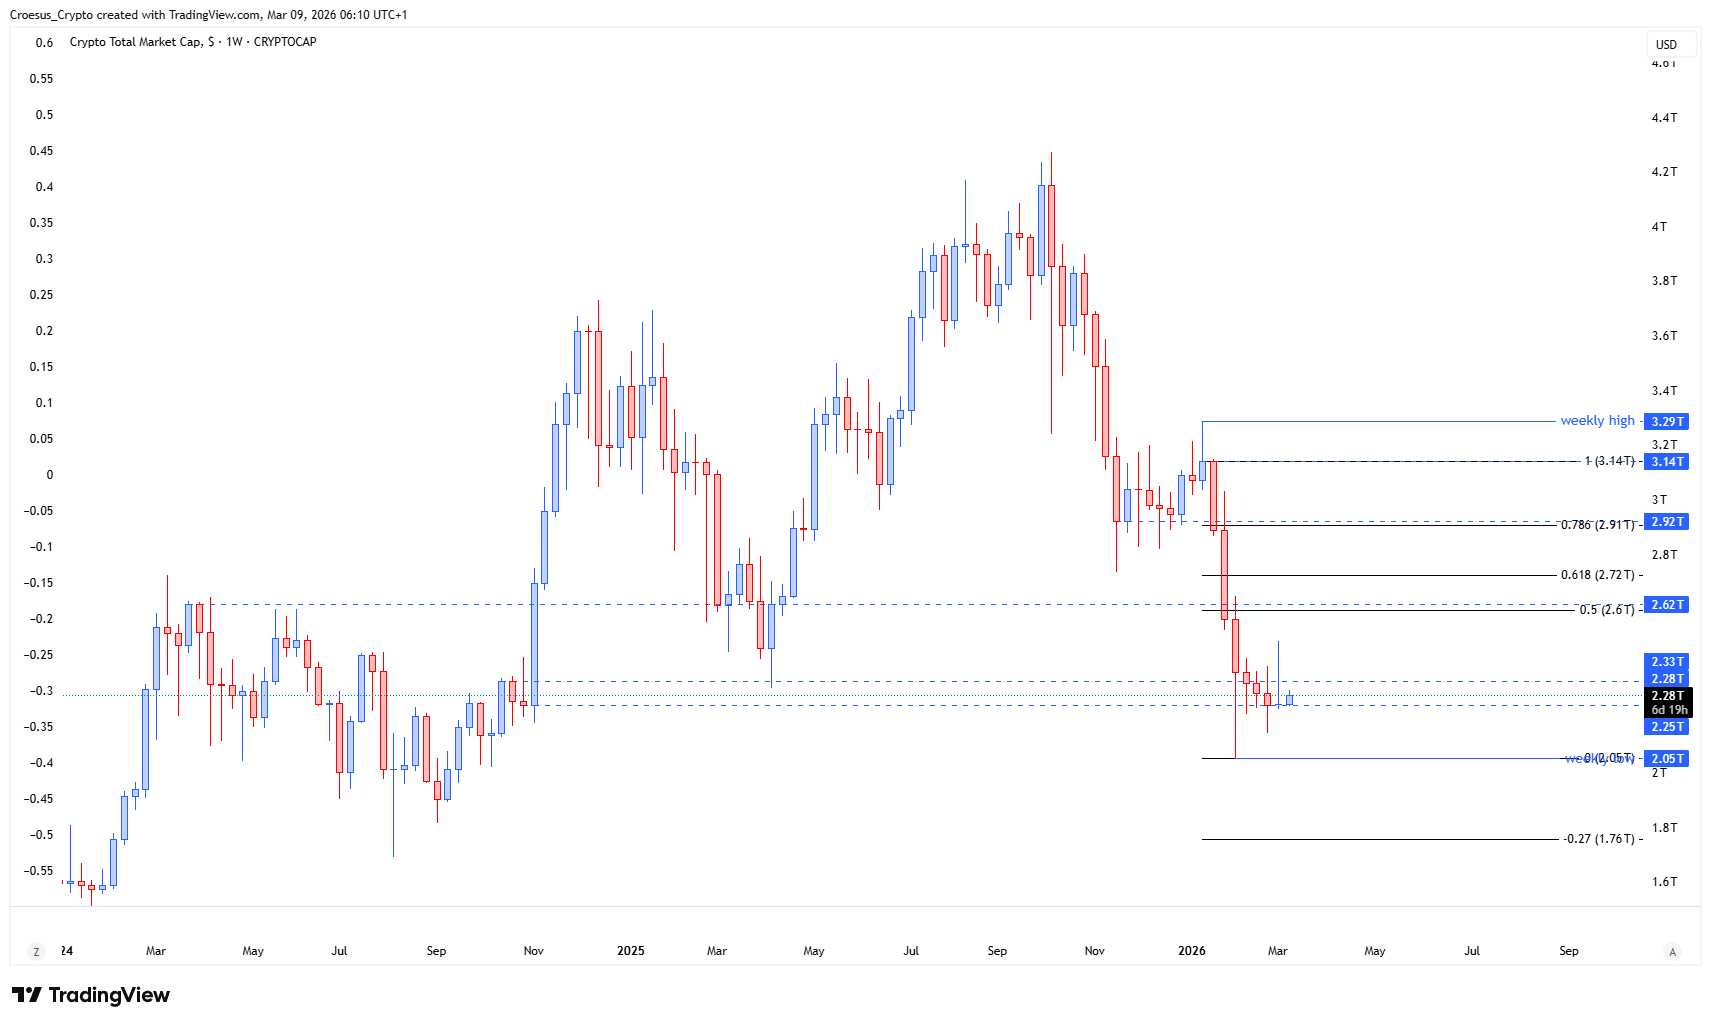
Key Levels and Scenarios
In the bearish PHASE 1 context, the base case remains that any upside is corrective until the index can reclaim and hold above the consolidation’s upper boundary. A bullish scenario requires clean acceptance above range resistance (not just a wick), followed by a successful retest that turns prior resistance into support. A bearish continuation scenario strengthens if price keeps rejecting at the range high and rotates back toward the range low, maintaining the consolidation structure.
- Range high (overhead resistance) as the key area that must be reclaimed with acceptance
- The rejection-wick high as the immediate invalidation area for sellers
- Mid-range zone as the typical chop/decision area inside consolidation
- Range low (structural support) as the key level bulls need to defend to avoid continuation down
Trading Implications
With consolidation and repeated rejection, risk typically increases for breakout attempts taken before acceptance. Our technical analysis focus stays on patience: conservative participants often wait for either a confirmed breakout-and-retest above resistance or a clear rejection and rotation that reaffirms the range.
This analysis is for informational purposes only and does not constitute financial advice.