TOTAL Marketcap / Crypto Total Market Cap
TOTAL weekly analysis week 12 March 2026. The total crypto market cap is currently in a bearish corrective phase where the recent relief rally is being capped by prior breakdown levels, keeping the broader structure vulnerable despite short-term upside attempts.
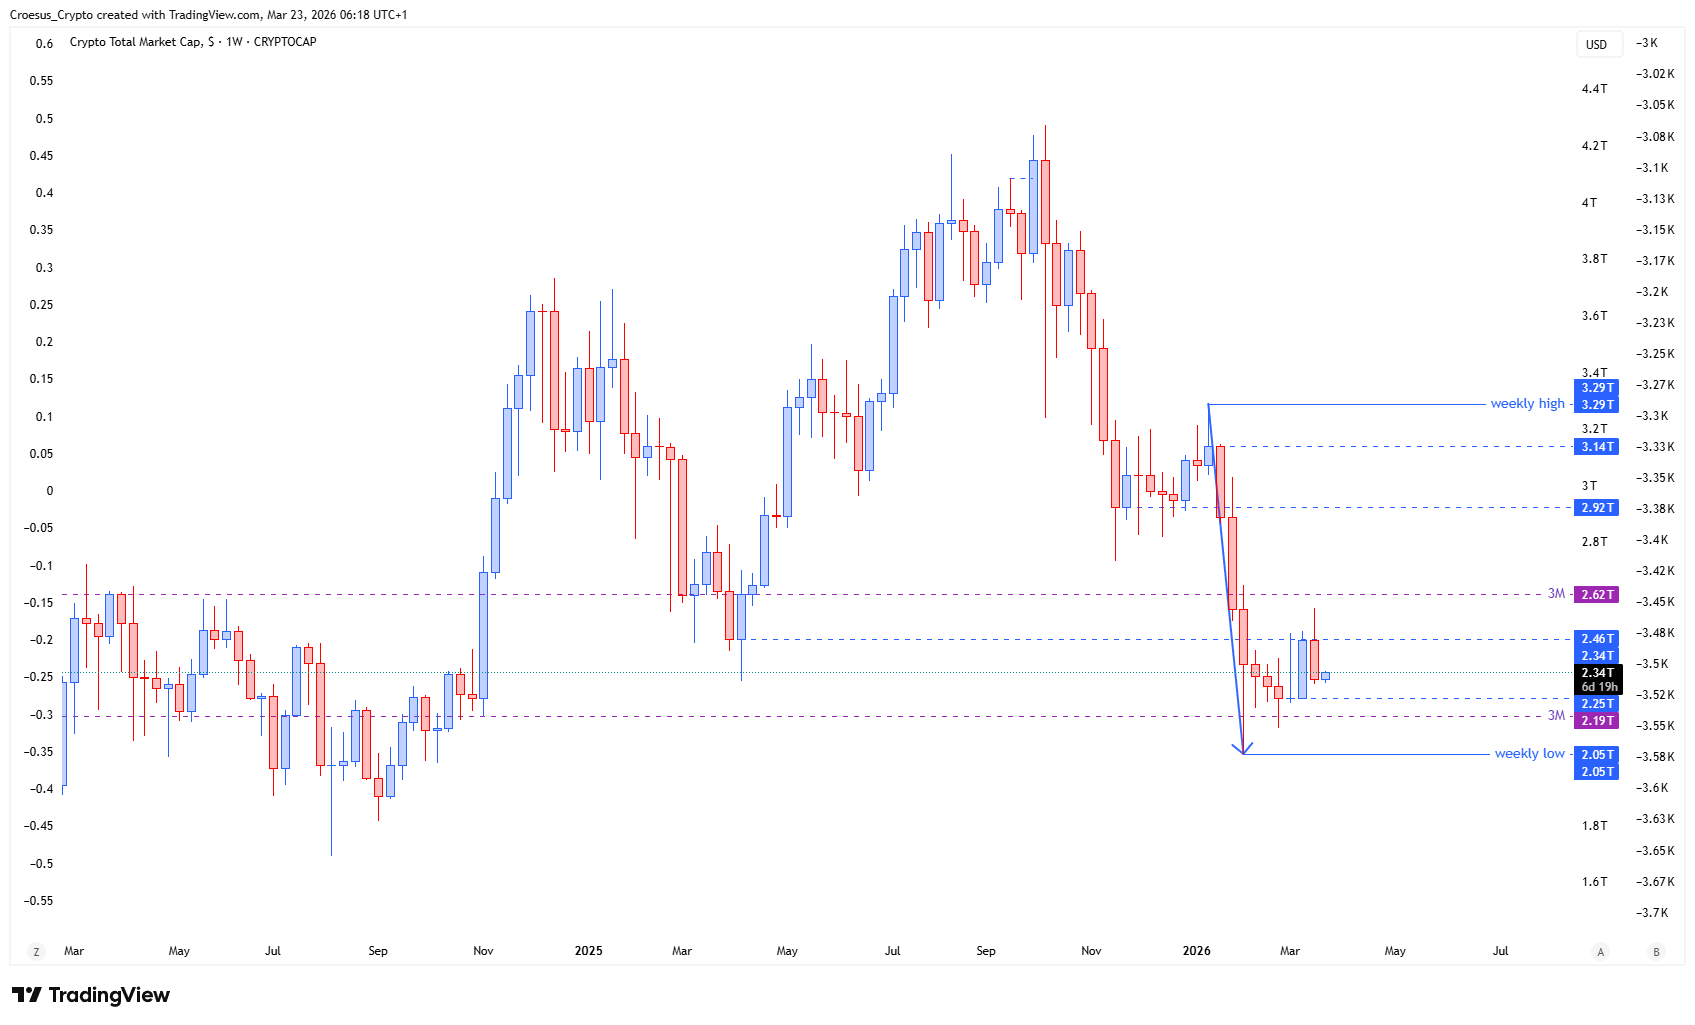
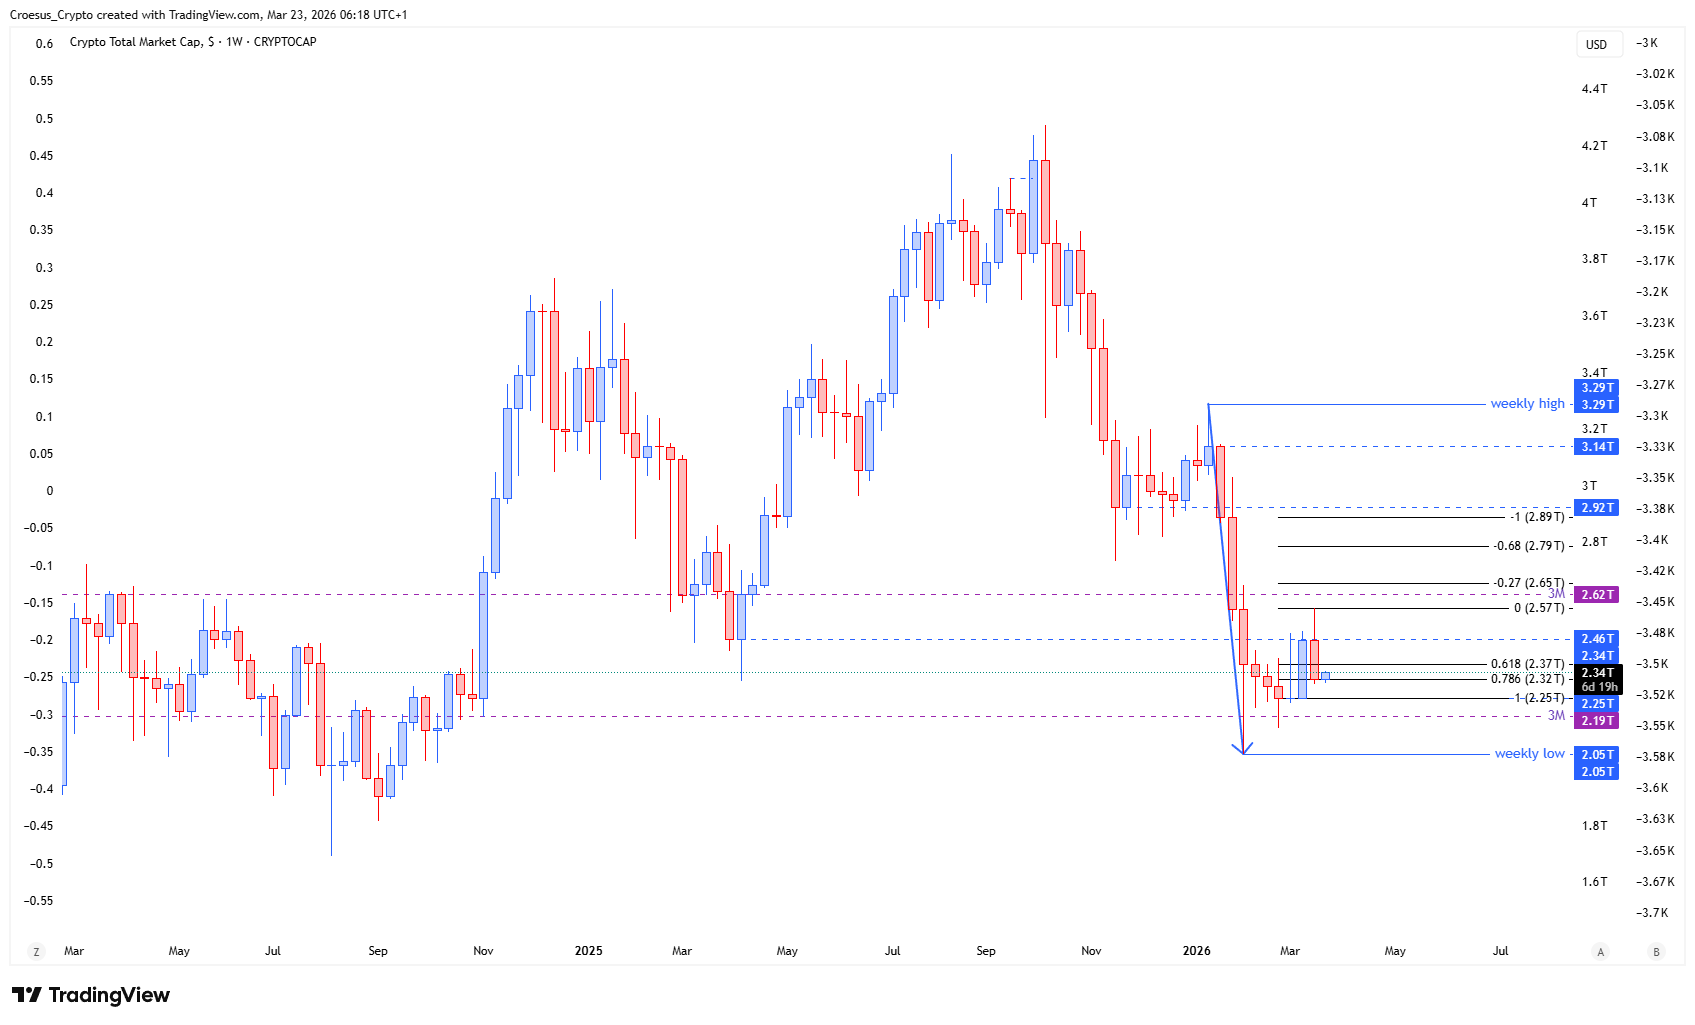
- The TOTAL index shows us the relief being stopped at the prior lows, pulling back towards the fib 0.786 level.
- If the index achieves to reverse again, creating a double bottom, we could see a bullish relief towards the 2.92T
- But we still have to remain cautious : this move is a bullish relief of a larger bearish impulse. Until proven otherwise, we expect a bearish continuation after the period of bullish relief.
Market Structure Analysis
From a market structure perspective, our TOTAL weekly analysis highlights a classic corrective response inside a larger bearish impulse: price pushed up in relief, then met supply where the market previously found support (the prior lows acting as resistance on the way back up). The pullback toward the Fibonacci 0.786 level signals a deeper retracement rather than an immediate trend reversal, which keeps the move classified as corrective until a clear break of structure develops. A potential double bottom would be the key reversal narrative here, but it only matters if it forms with buyers defending the same swing-low zone and reclaiming nearby resistance; otherwise, the relief risks turning into a lower high that fuels continuation.
In short, support resistance behavior remains the main driver, with Fibonacci acting as a secondary confirmation tool.
Key Levels and Scenarios
Bullish relief remains possible if the market holds the retracement area and successfully builds a double bottom, opening room for a push toward the $2.92T area. Bearish continuation remains our base case in this TOTAL daily analysis: if the relief fails to reclaim the prior-lows resistance and the retracement breaks down, the larger bearish impulse likely reasserts itself.
- Prior lows zone acting as resistance (relief being “stopped” here)
- Fibonacci 0.786 level as the current corrective pullback area
- Double bottom zone as the key reversal trigger (if buyers defend it)
- $2.92T as the upside relief objective if a reversal confirms
This analysis is for informational purposes only and does not constitute financial advice.