

TOTAL Marketcap / Crypto Total Market Cap
TOTAL weekly analysis Week 15 2026. The total crypto market cap is pressing into higher-timeframe resistance, but our technical analysis remains cautious as price fails to confirm strength with a weekly close above the level.
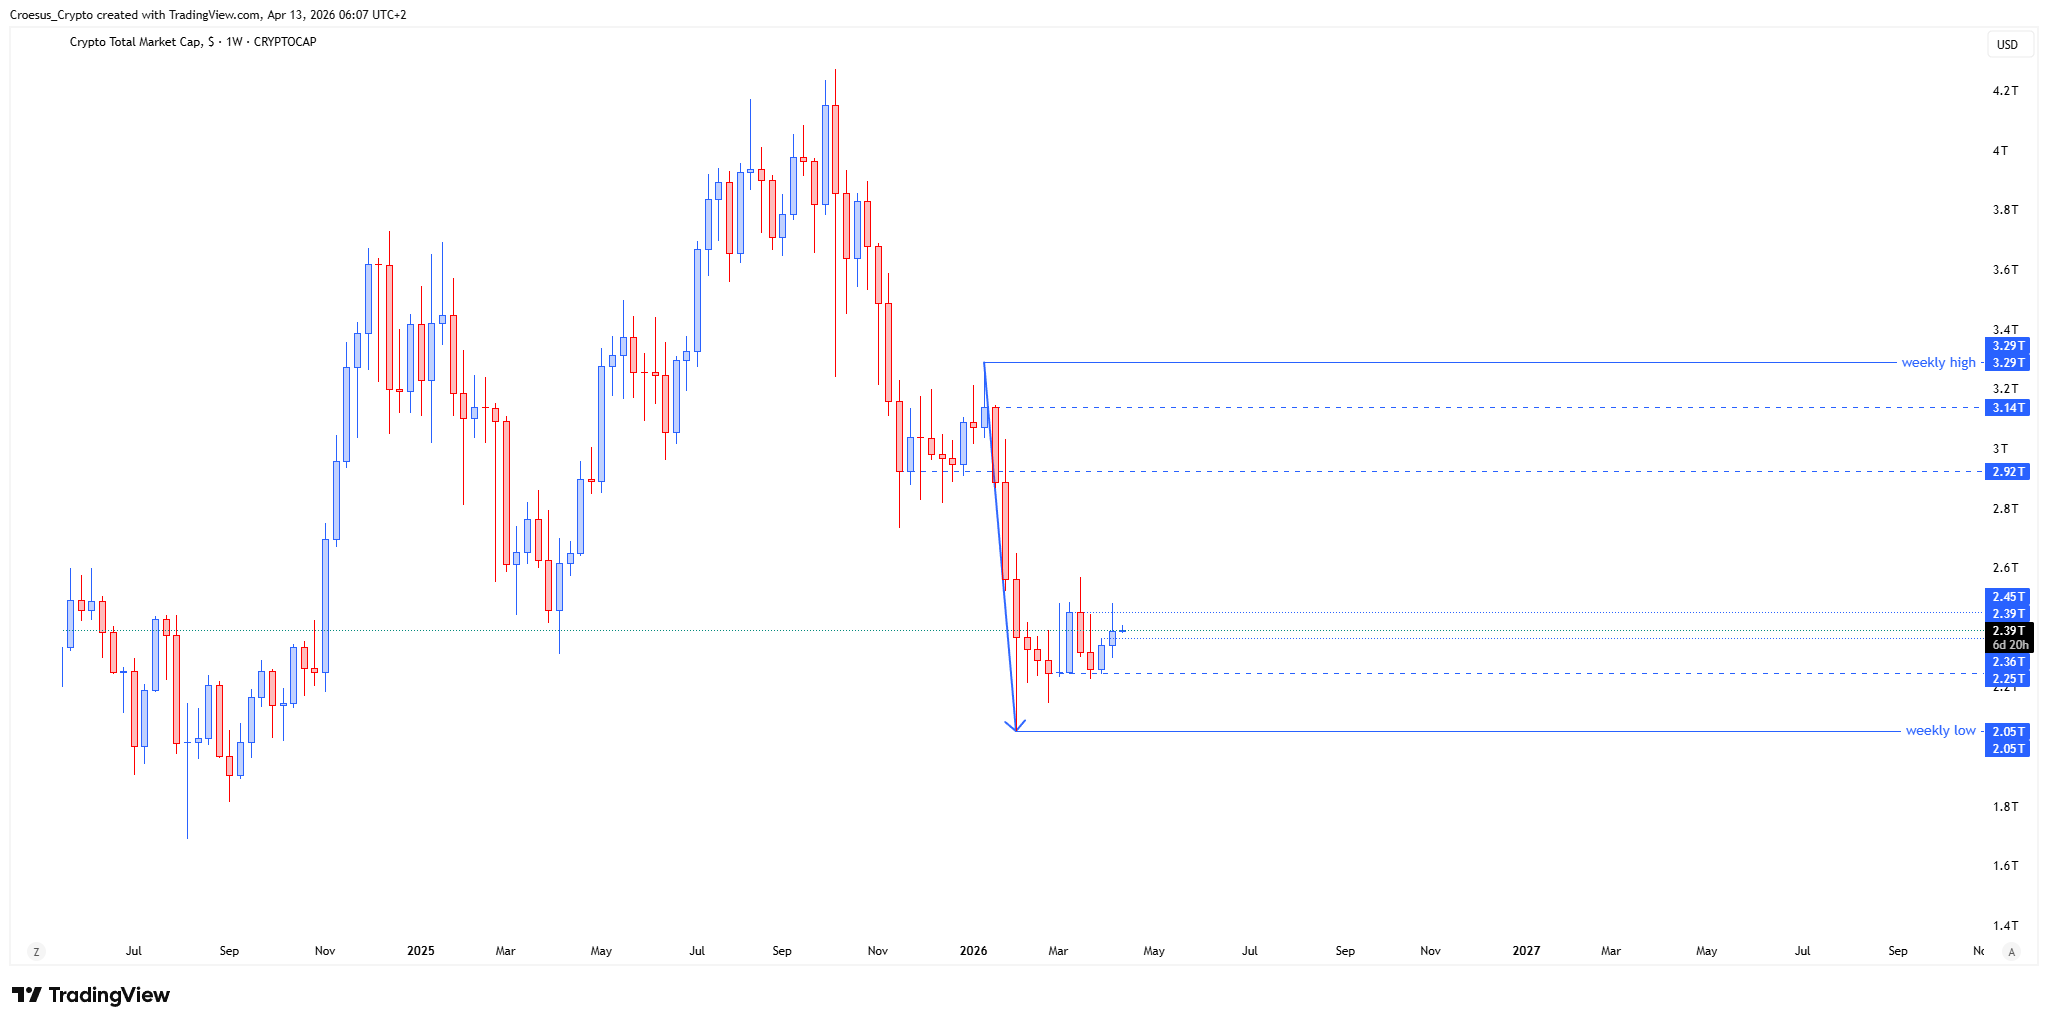
- The TOTAL index shows us that it pushed into a weekly level but failed to close above it.
- If we fail to break higher, we need to look for fresh liquidity lower within the local weekly range between 2.25T and 2.45T
- The double bottom base area is the primary structural support zone to hold
Market Structure Analysis
From a market structure perspective, this TOTAL weekly analysis is defined by a push into a weekly supply area followed by a failure to secure acceptance above it.
In Croesus methodology, that lack of a weekly close is a key tell: it often signals a corrective phase where price probes for liquidity rather than extending an impulsive breakout. With price still operating inside a local weekly range, the $2.25T–$2.45T band becomes the main map for support resistance. The double bottom base area functions as the structural floor of the range; as long as that base holds, downside is more likely to be a sweep into liquidity and a reaction, rather than a clean trend continuation lower.
Key Levels and Scenarios
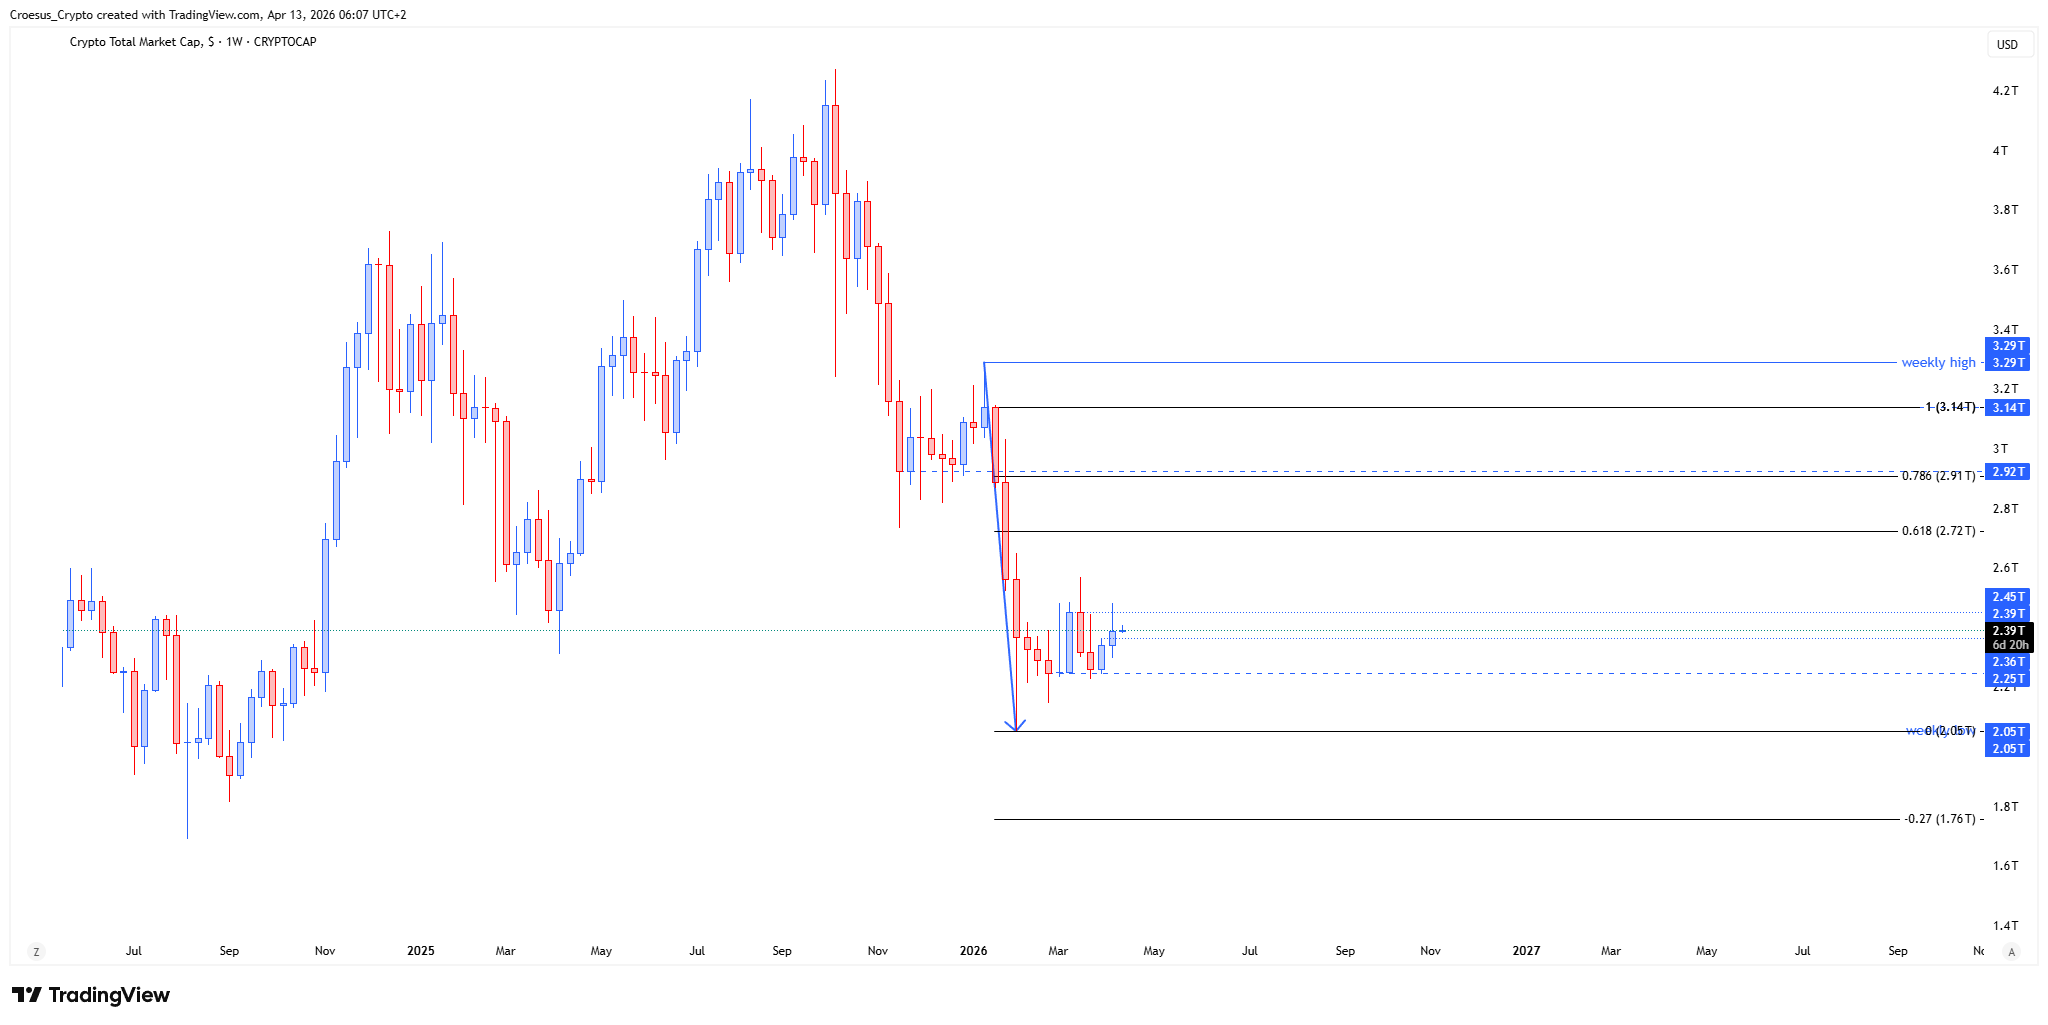
Bearish continuation stays in play while price remains rejected from the weekly level and fails to break higher. The primary expectation is a rotation back into the range to seek “fresh liquidity” toward the lower band, with the double bottom base as the must-hold structural support. A bullish shift requires reclaiming the weekly level with acceptance (weekly close), which would reduce the probability of a deeper corrective sweep.
- Weekly level overhead acts as the key rejection / reclaim trigger
- 2.45T is the local weekly range high and upper boundary for acceptance
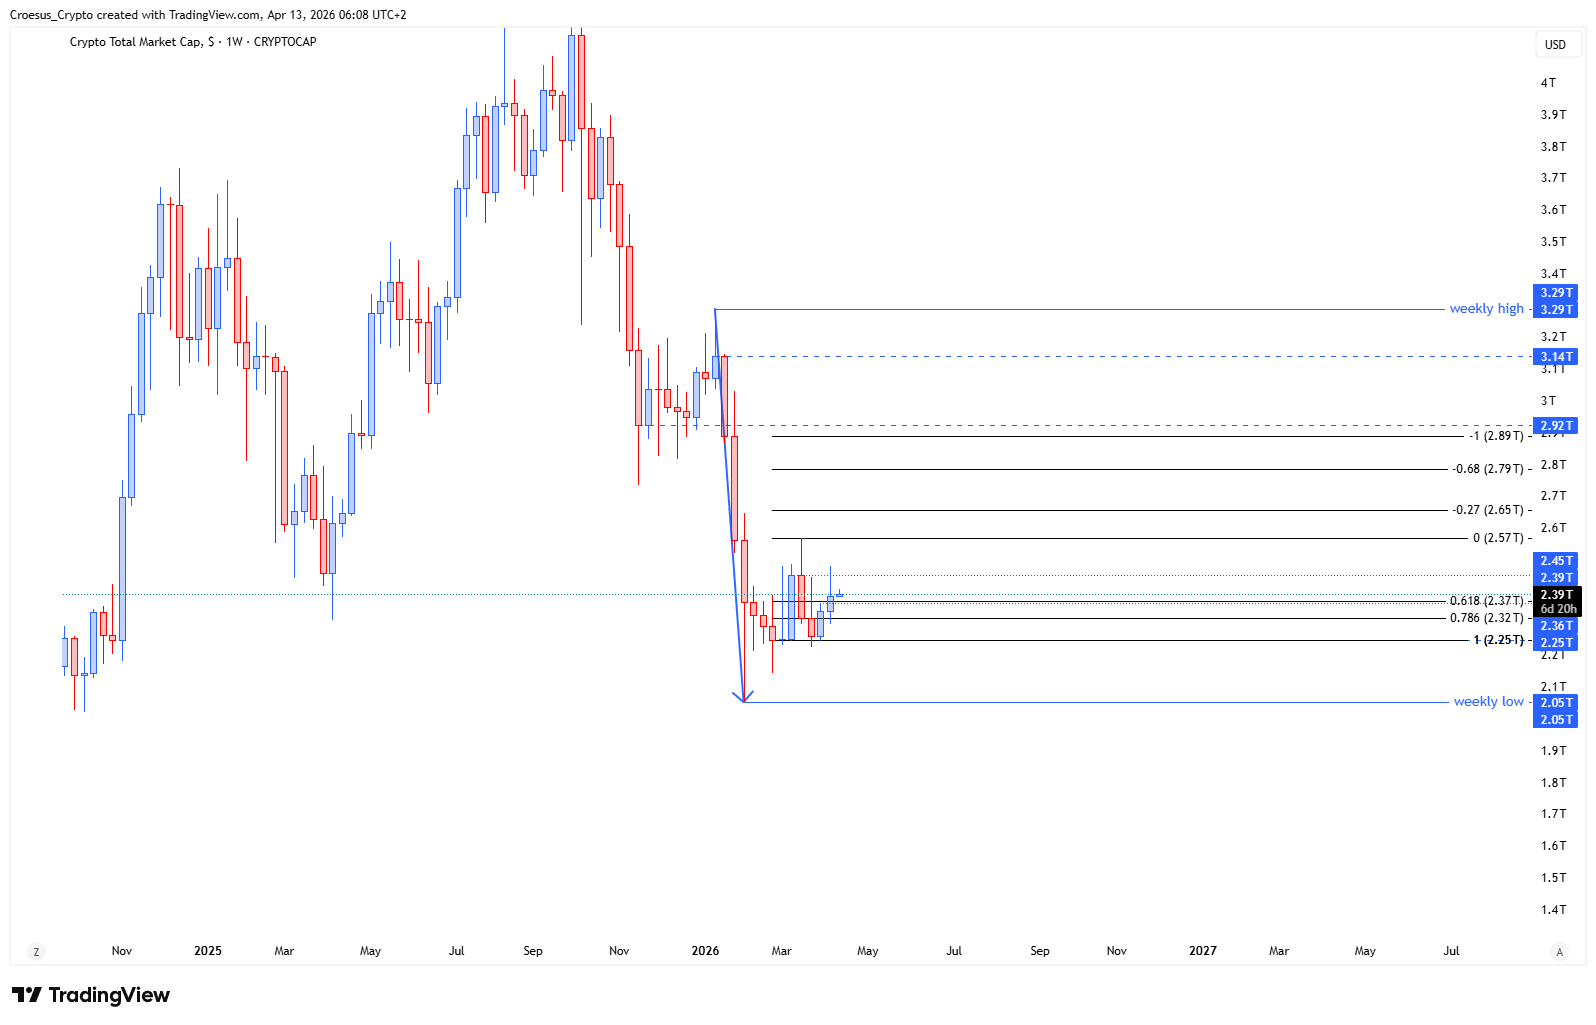
- 2.25T is the local weekly range low and the primary liquidity draw if price rotates lower
- Double bottom base area is the main structural support zone and invalidation reference
Trading Implications
In this TOTAL weekly analysis, risk is concentrated around the weekly level: aggressive participants typically look for confirmation (rejection vs reclaim) before committing, while conservative positioning waits for either a sweep into the lower range liquidity or a confirmed acceptance above resistance. Until the range resolves, execution quality improves by treating moves as corrective rotations rather than assuming immediate trend extension.
This analysis is for informational purposes only and does not constitute financial advice.