TOTAL Marketcap / Crypto Total Market Cap
TOTAL weekly analysis Week 16 2026. The TOTAL index remains structurally bearish as the current pullback stalls into major resistance, keeping the broader corrective phase intact after a strong weekly sell-off.
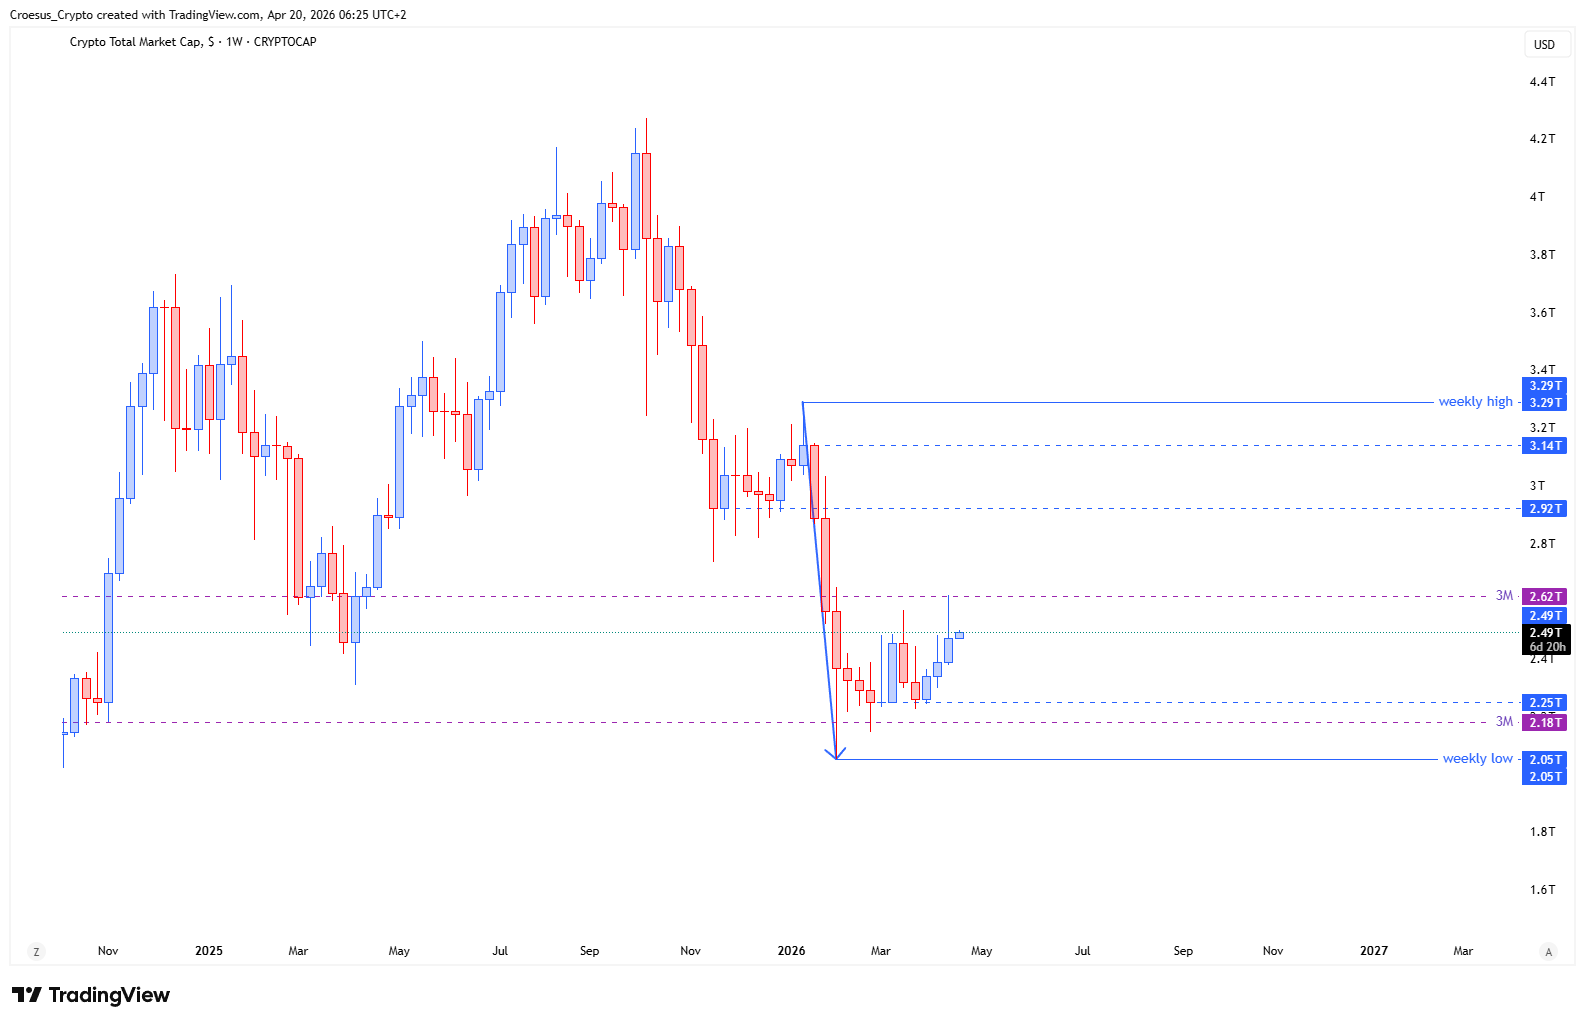

- The TOTAL index shows us that it pushed into a 3M level but got rejected there
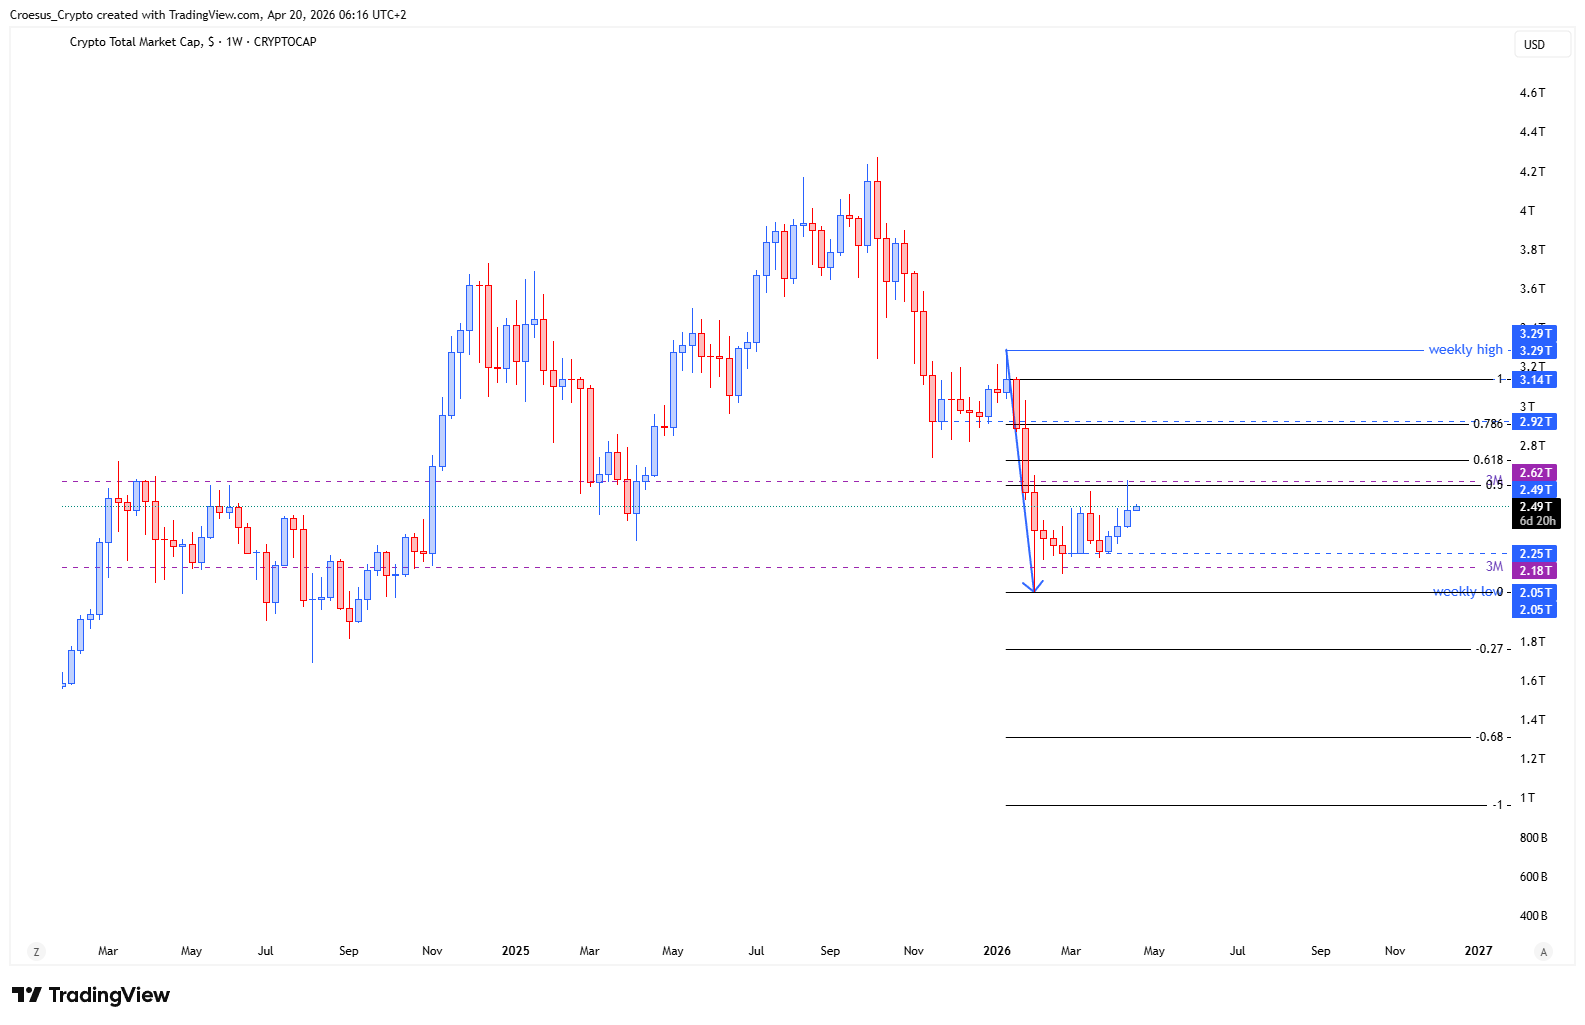
- If we take a Fibonacci retracement from the weekly bearish impulsive move down, we can see that the index pulled back into the 0.5 level which shows a confluence with that 3M level. The prior bearish push down also corrected into the 0.5 level before getting bearish continuation.
- This clearly a level of major resistance that needs to be cleared before seeing any bullish continuation
Market Structure Analysis
From a naked trading perspective, our TOTAL weekly analysis is defined by a bearish impulse followed by a corrective retracement into overhead supply. The rejection at the 3M level signals that sellers are still defending that zone, and the Fibonacci 0.5 retracement aligning with the same area creates clear confluence for resistance. Structurally, this kind of pullback into the midpoint of a bearish leg is often where the market decides between continuation and a deeper reversal attempt. As long as price remains capped at this confluence, the correction reads as a pause within a larger bearish sequence rather than a confirmed trend shift.
Key Levels and Scenarios
In this TOTAL weekly analysis, the bearish scenario remains favored while price is rejected from the 3M / 0.5 Fibonacci confluence, as that keeps the corrective structure from turning into a bullish break. A bullish continuation case requires a clean reclaim and acceptance above that resistance, showing buyers can hold above prior supply rather than just wicking into it.
- 3M level: primary horizontal resistance where price recently rejected
- 0.5 Fibonacci retracement: key confluence level within the corrective pullback
- Weekly swing low of the bearish impulsive move: structural downside reference for continuation risk
- The rejection zone itself: acts as invalidation for bulls until reclaimed and held
Trading Implications
With resistance clearly defined, risk is typically easier to manage, but confirmation matters: aggressive traders tend to focus on rejection behavior at resistance, while conservative traders often wait for a reclaim and retest before treating the move as a trend change. Until the market proves acceptance above the confluence, the structure remains corrective within a bearish context.
This analysis is for informational purposes only and does not constitute financial advice.