

The TOTAL weekly analysis for week 2 January 2026 shows a dominant bearish impulsive leg still in control, while price begins to slow and potentially transition into a bullish corrective move. We are monitoring how the current double bottom and reclaimed support behave against the higher-timeframe yearly level and overhead resistance.
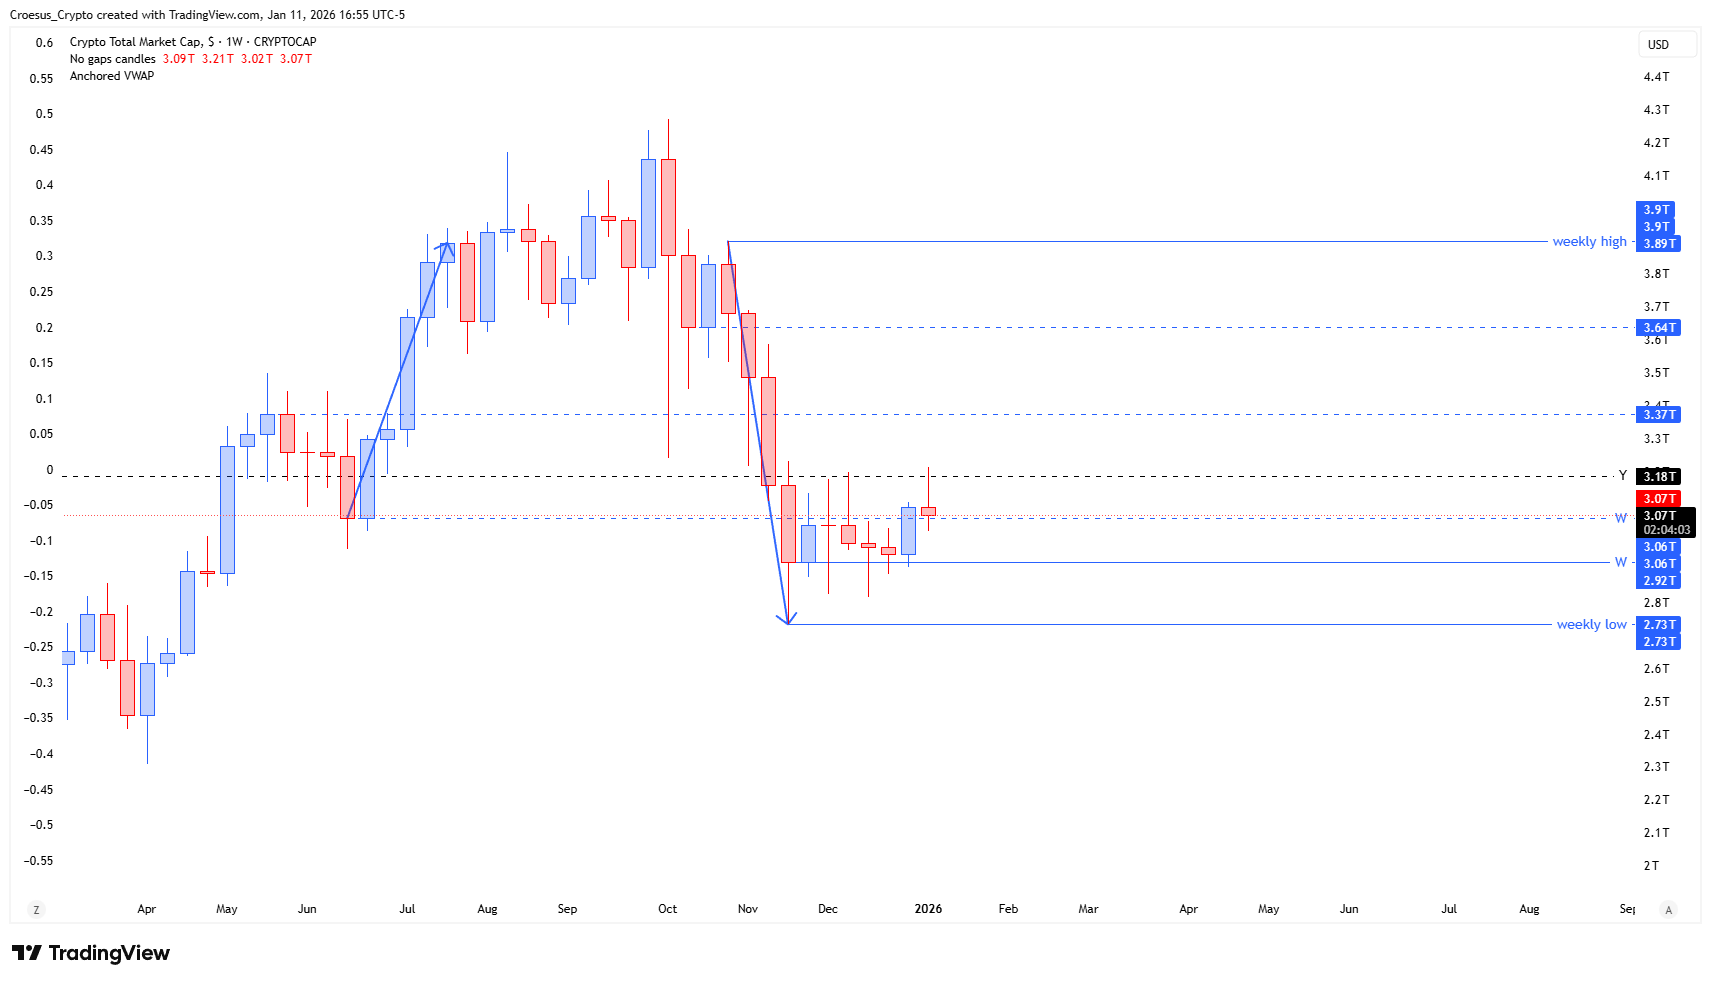
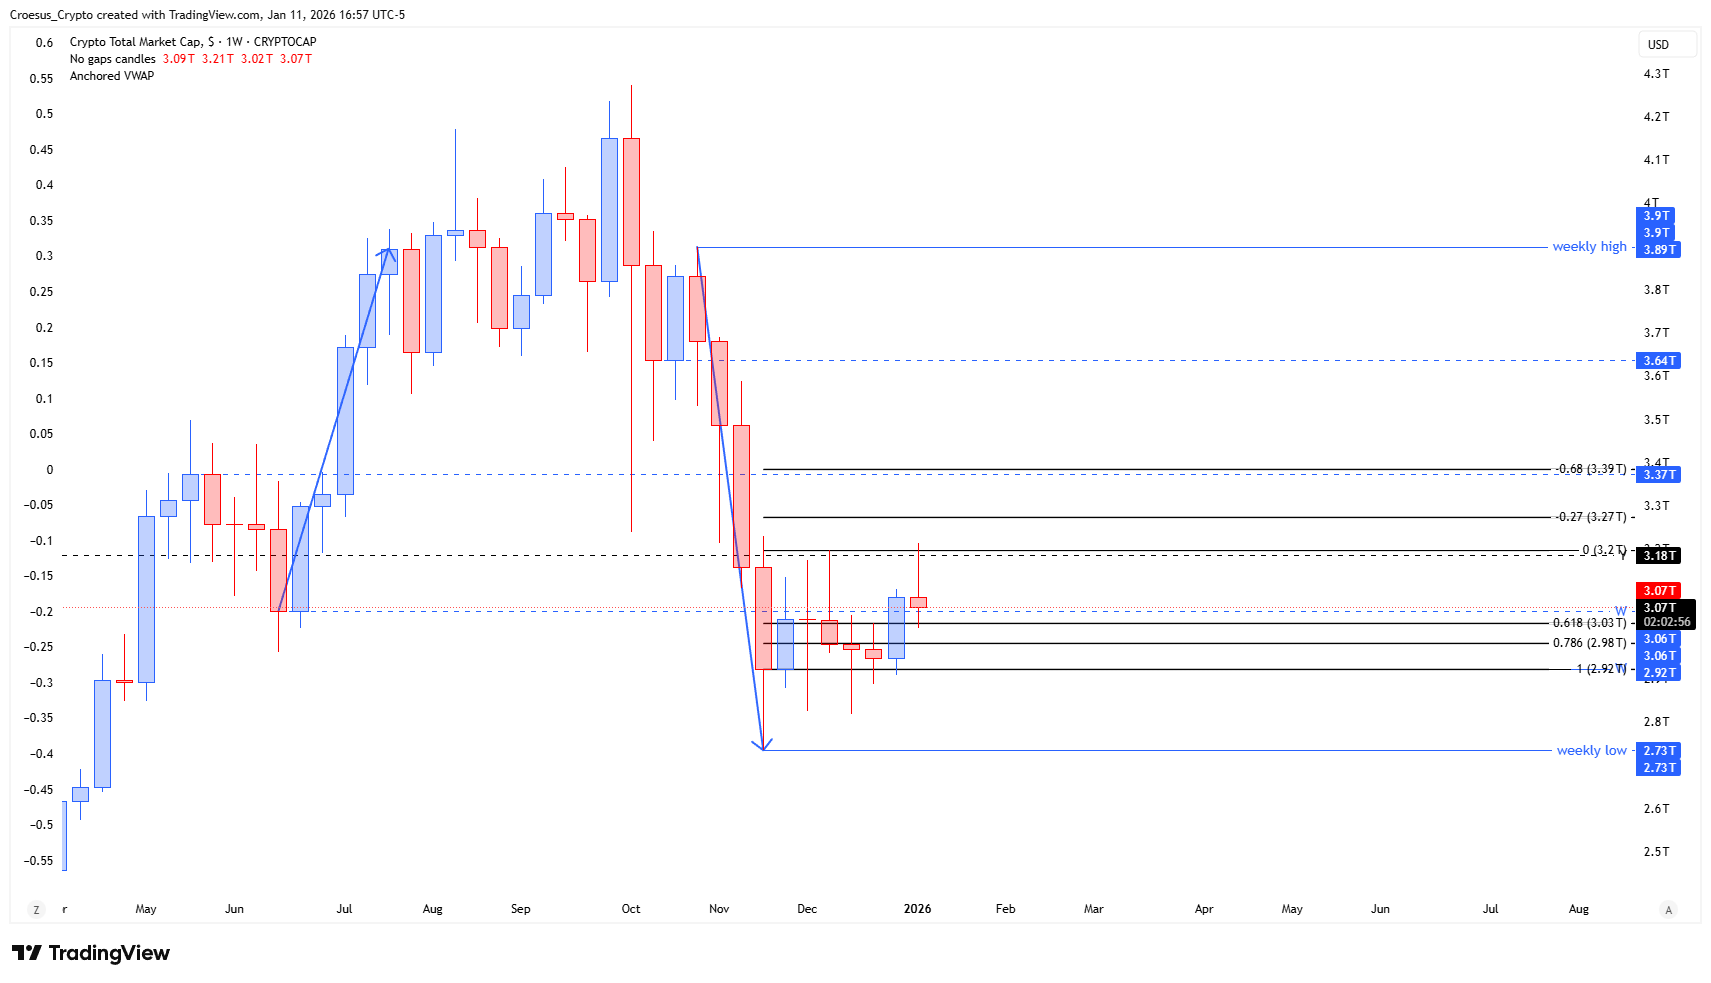
TOTAL weekly chart 11 January 2026 with support resistance levels and double bottom structure.
Technical Analysis Key Points
- The game that still is in play, is a bearish impulsive move down, followed by a slowing down of the price, possibly to initiate a bullish corrective move.
- At this moment we can see double bottom being printed.
- The index hovered around between the supportlevel of 2.92T and 3.06T, a supportlevel from mid June, that became resistance now.
- If we look back to the past where this level comes from, we can see that this level was the start of a very strong push up. Until where ? Until 3.9T, the level where the actual bearish push down originated.
- We can see that last week the index broke through that 3.06T and retested it succesfully this week.
- Could this be the start of a (corrective) bullish push up ?
- One major obstacle remains the yearly level. During the prior push up we could also see that this level was broken and retested before the push really started.
- If this move plays out, we can see confluence at the fib -0.68 with prior highs.
Market Structure Analysis
Our technical analysis focuses on the strong weekly impulse down from ~3.9T, which still defines the primary trend. Price has now formed a clear double bottom in the 2.73T–2.92T zone, followed by a reclaim of the 3.06T level that previously capped price as resistance. This area acted as the origin of a strong historical rally, so its current reclaim is significant for market structure.
The key structural hurdle is the yearly level around 3.18T. In the prior rally, breaking and retesting this level was the trigger for a powerful continuation up, so we watch for a similar pattern: acceptance above 3.18T would confirm a more meaningful corrective phase rather than just a short-covering bounce. Confluence between the -0.68 Fibonacci extension and prior highs strengthens the case for a corrective move targeting the 3.37T–3.64T region if the yearly level gives way.
Key Levels and Scenarios
Bullish scenario: As long as the 2.92T–3.06T zone holds as support, we can see a corrective push toward 3.18T, then 3.37T–3.64T (roughly +10–20% from current levels). Failure back below 2.92T would invalidate the bullish corrective thesis and reopen the path to the 2.73T weekly low.
Key support and resistance levels to watch:
2.73T – Weekly low and double-bottom base; loss opens further downside.
2.92T – Local support; first line in the sand for the bullish corrective scenario.
3.06T – Reclaimed support; must continue to hold on weekly closes.
3.18T – Yearly level; break and retest needed to unlock higher corrective targets.
3.37T–3.64T – Resistance cluster with prior highs and -0.68 Fibonacci confluence; key profit-taking zone if correction extends.
Trading implications
For active traders, the 2.92T–3.06T band can serve as a potential demand zone for reduced-risk entries, with invalidation below 2.92T and upside targets stepped through 3.18T and 3.37T–3.64T; position sizing should respect the higher-timeframe bearish trend and the possibility that this remains only a short-term correction.
This analysis is for educational and informational purposes only and is not financial advice. Always do your own research and make your own trading decisions. Trading and investing in crypto assets involve significant risk, including the risk of loss of capital.