

TOTAL Marketcap / Crypto Total Market Cap
TOTAL weekly analysis Week 20 2026. The TOTAL index remains in a bearish environment, with the current move presenting as a corrective push into resistance rather than a confirmed bullish impulse, keeping traders focused on acceptance versus rejection at key supply.
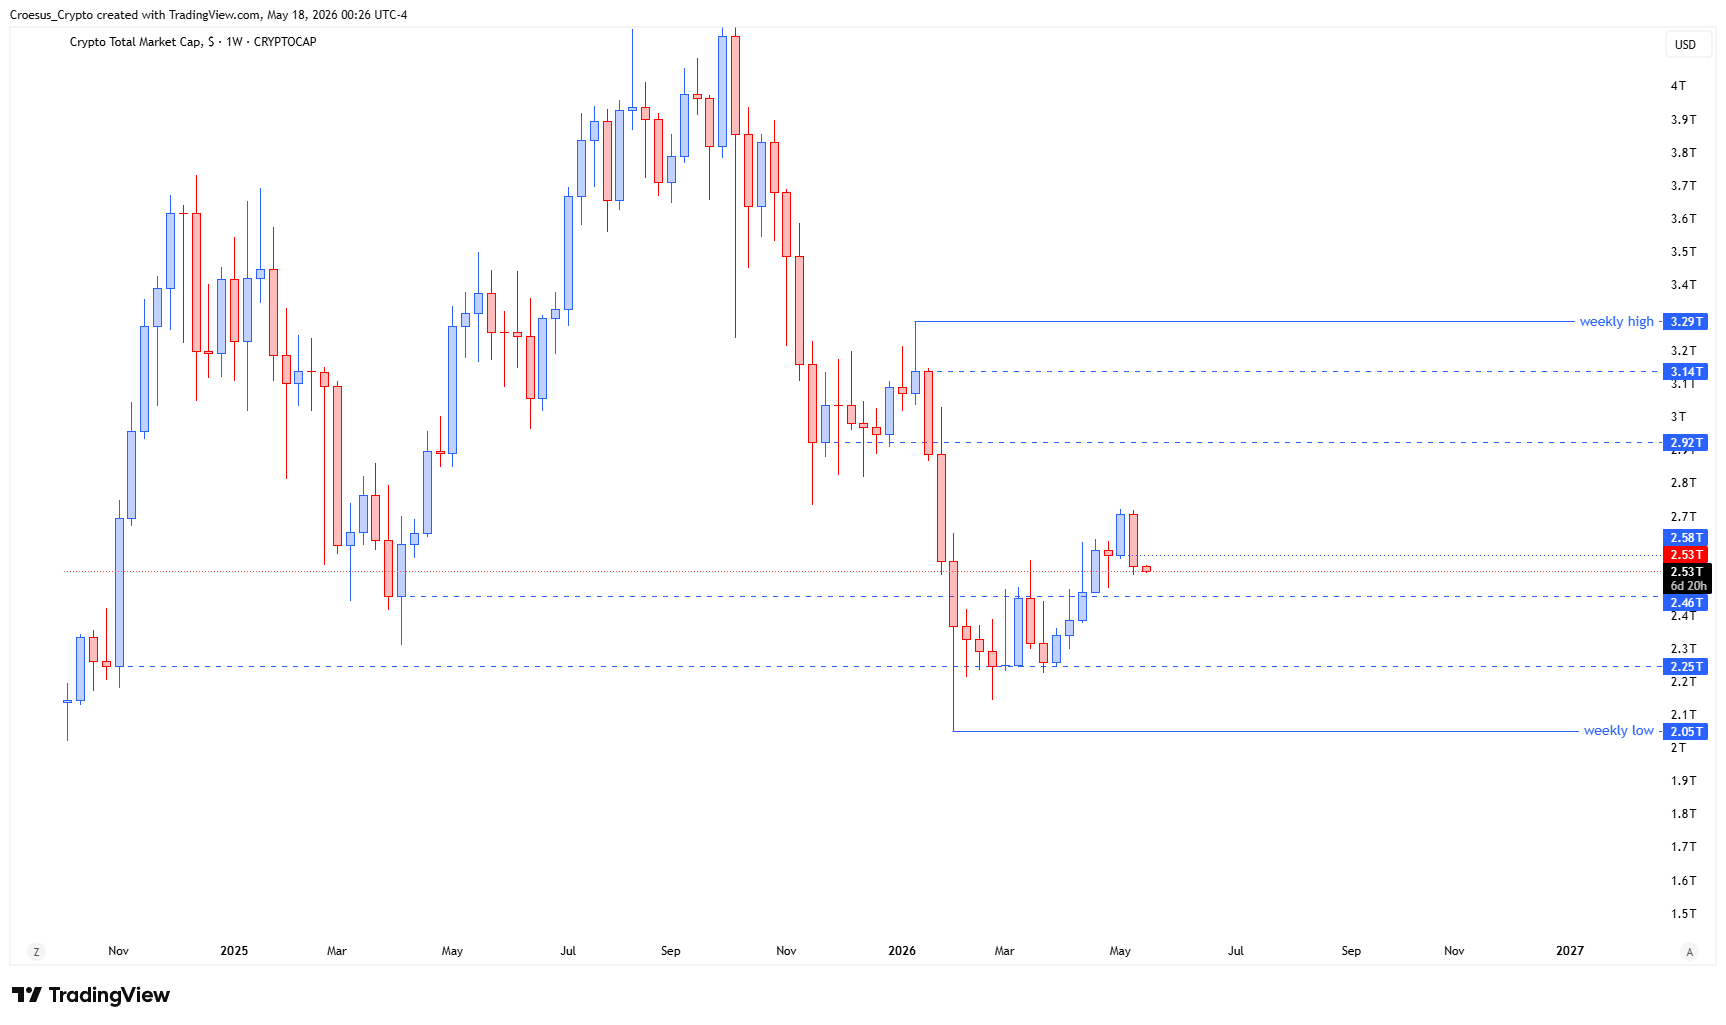
- The TOTAL index shows us that the index failed to close above the prior weekly level, but did not break the swing low yet.
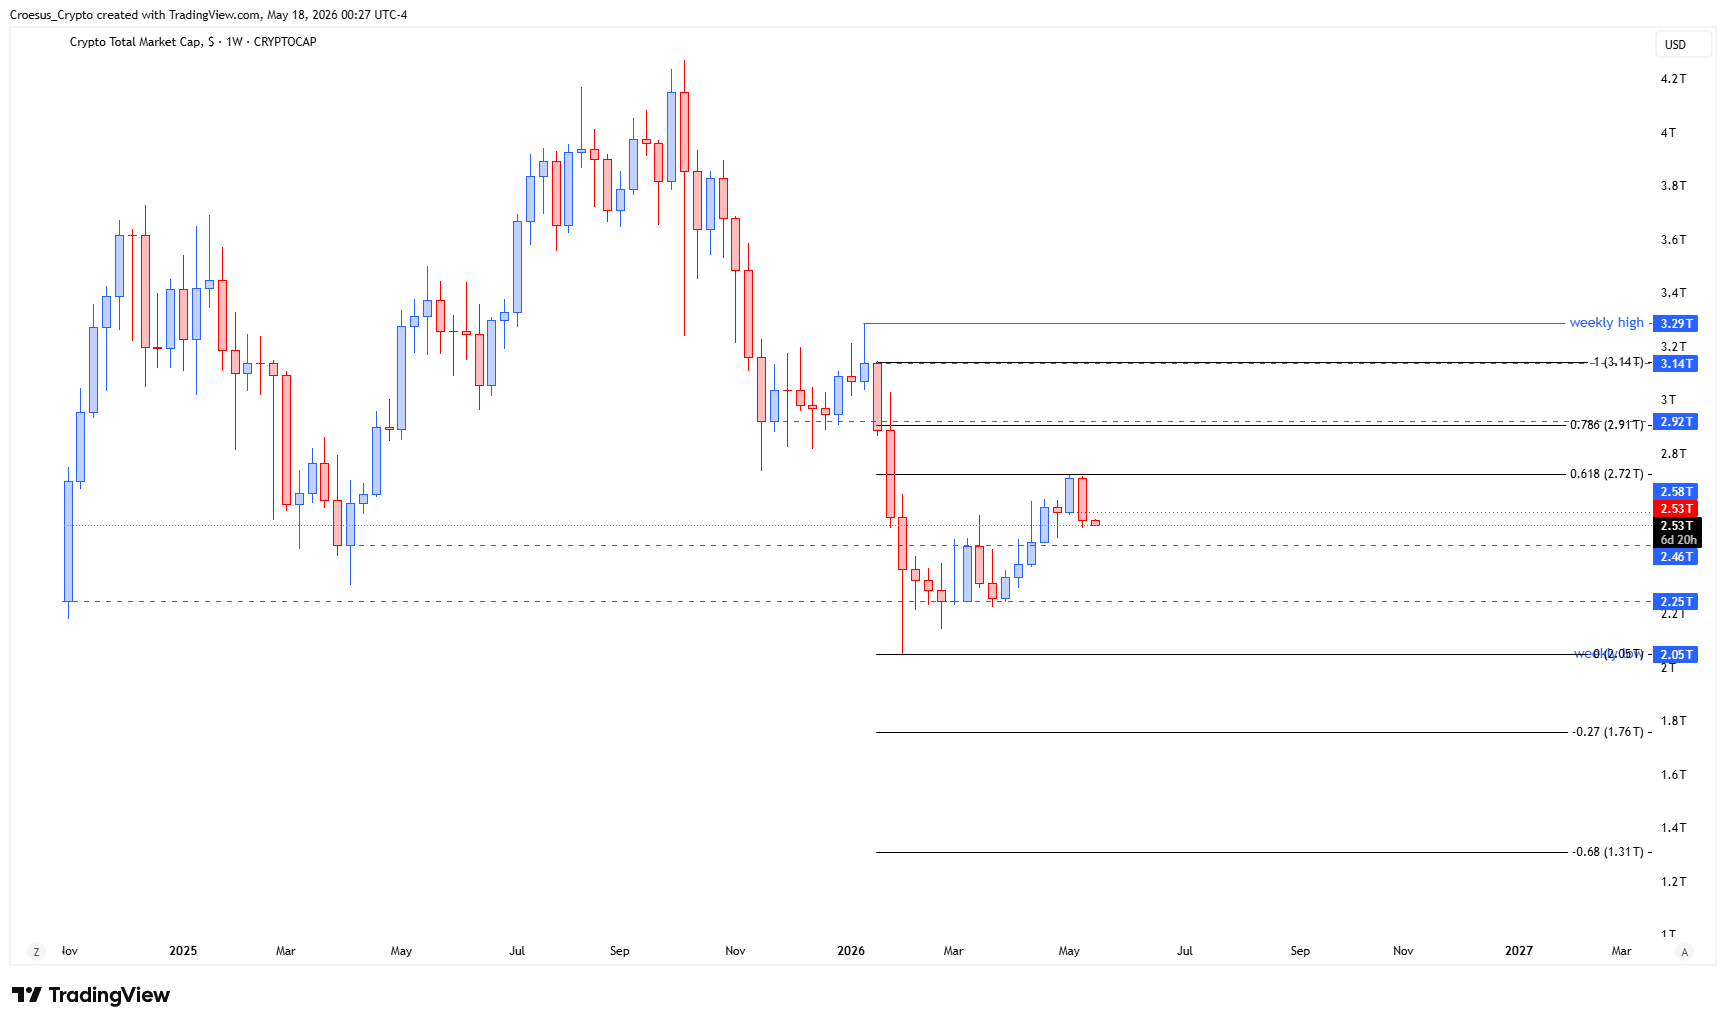
- At this moment we haven't seen a fib retracement into the 0.618 level yet (nearly). But we have to be aware that not every retracement succeeds. If the bears remain too strong, we have to be conscious that this could be the start of a further bearish continuation. However much we want to be bullish, we still have to be aware that we are in a bullish correction of a bearish impuls. This is, at this moment, by no means a bullish impulse.
- We have take two scenarios into account at this moment : either this is a local pullback to get liquidity and initiate a new bullish corrective move, or we are finished correcting and the bearish continuation has reinitiated
Market Structure Analysis
From a market structure perspective, this TOTAL weekly analysis highlights a corrective push into overhead supply rather than a clean impulsive continuation. Price filled the prior week’s wick, which typically acts as a retest of a rejection zone where sellers previously stepped in, and the failure to close above the prior weekly level keeps the structure capped at resistance. With the index holding above the swing low, bearish continuation is not confirmed yet, but the move still reads as a counter-trend correction within a broader bearish impulse. The 50% marker of the weekly range is acting as a mid-range inflection area: acceptance above it needs follow-through to signal strength, while rejection keeps the path open for rotation back through the range. Fibonacci context remains relevant here, as the market has not cleanly delivered a 0.618 retracement, reinforcing that the current correction can fail early if sellers stay dominant.
Key Levels and Scenarios
In this technical analysis, the bullish case requires a decisive weekly close above the wick-fill area and acceptance above the $2.62T weekly/3M confluence to flip that zone into support resistance. The bearish case remains favored while price is rejected from that region, keeping the move corrective and maintaining risk of renewed bearish continuation through the weekly range.
- $2.62T weekly resistance (confluent with strong 3M level)
- The 50% marker of the weekly range as a key decision point for continuation vs rotation
- Last week’s wick high zone as the immediate rejection/acceptance area
Trading Implications
With trend labeled bearish PHASE 1, our TOTAL weekly analysis suggests traders typically prioritize clarity around resistance reactions: aggressive participants often focus on rejection confirmation at the $2.62T confluence, while conservative participants generally wait for a weekly close above resistance and a clean retest before treating any upside as structural. Until that shift is confirmed, the $2.62T zone remains the key invalidation area for bearish continuation scenarios.
This analysis is for informational purposes only and does not constitute financial advice.