Our TOTAL weekly analysis for Week 3 January 2026 focuses on price action around the key 3.14T support/resistance area. The latest weekly candle closes just above this level, followed by a quick retest of the recent low. For clearer directional bias, our technical analysis now shifts to lower timeframes, especially the 4H chart, to confirm whether buyers can launch a fresh attack on 3.14T.
TOTAL weekly chart Week 3 January 2026 with support resistance level at 3.14T and quick retest of recent lows.
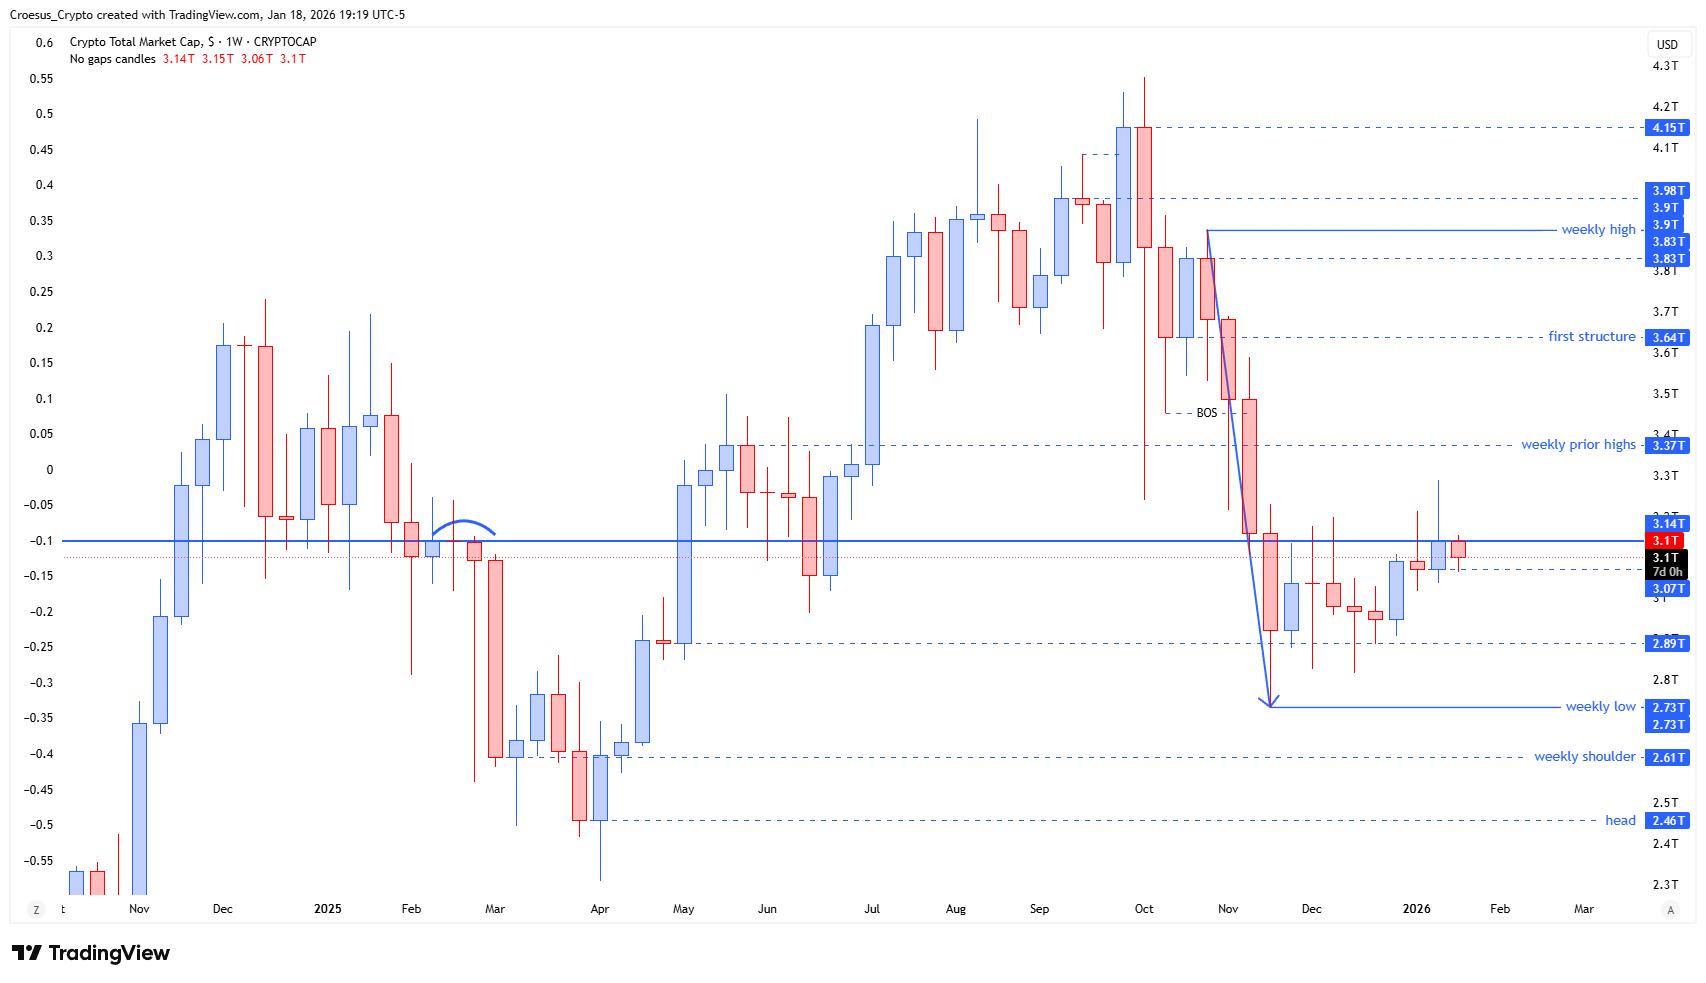
Technical Analysis Key Points
- The weekly candle of the TOTAL closed slighthly above the support/resistance level @3.14T.
- We see a quick retest of the low.
- We have to zoom in on the 4H if we see a strong bullish reversal in order to attack that level again
Market Structure Analysis
From a market structure perspective, TOTAL is currently balanced around a major support resistance pivot at 3.14T. The close “slightly above” suggests buyers defended this level on a weekly basis, but the swift retest of the low shows that liquidity remains heavy below. There is no clear weekly reversal pattern yet, so confirmation must come from intraday action.
On the 4H, we want to see a strong bullish reversal structure—engulfing candle, higher low, or similar—before treating 3.14T as confirmed support. Until that happens, the level acts as a neutral pivot rather than a clean base. Fibonacci tools can then be applied from the low to the 3.14T region to refine potential retracement and extension zones, but only after a clear reaction is printed.
Key Levels and Scenarios
Bullish scenario: if the 4H timeframe prints a strong bullish reversal from the retested lows while the weekly candle continues to hold above 3.14T, we expect another test—and potential break—of this resistance area, opening room for further upside in the TOTAL weekly analysis.
Key levels to watch
3.14T support/resistance: central weekly pivot; must hold for the bullish case.
Recent retested low: short-term liquidity pool; strong bounce here would confirm intraday demand.
4H reversal zone: area where a clear bullish 4H pattern would justify renewed long exposure.
Weekly close below 3.14T: invalidation signal for immediate bullish continuation.
Trading implications
Given the current structure, we prefer to wait for a decisive 4H bullish reversal before entering, place invalidation just below the retested low, and size positions conservatively until 3.14T is clearly reclaimed as support.
This analysis is for educational and informational purposes only and is not financial advice. Always do your own research and make your own trading decisions. Trading and investing in crypto assets involve significant risk, including the risk of loss of capital.