

TOTAL Marketcap / Crypto Total Market Cap
TOTAL weekly analysis Week 4 January 2026. The total crypto market cap is pressing back into key downside liquidity, with price retesting the lows aggressively while still potentially developing a corrective structure after the prior bearish impulse.
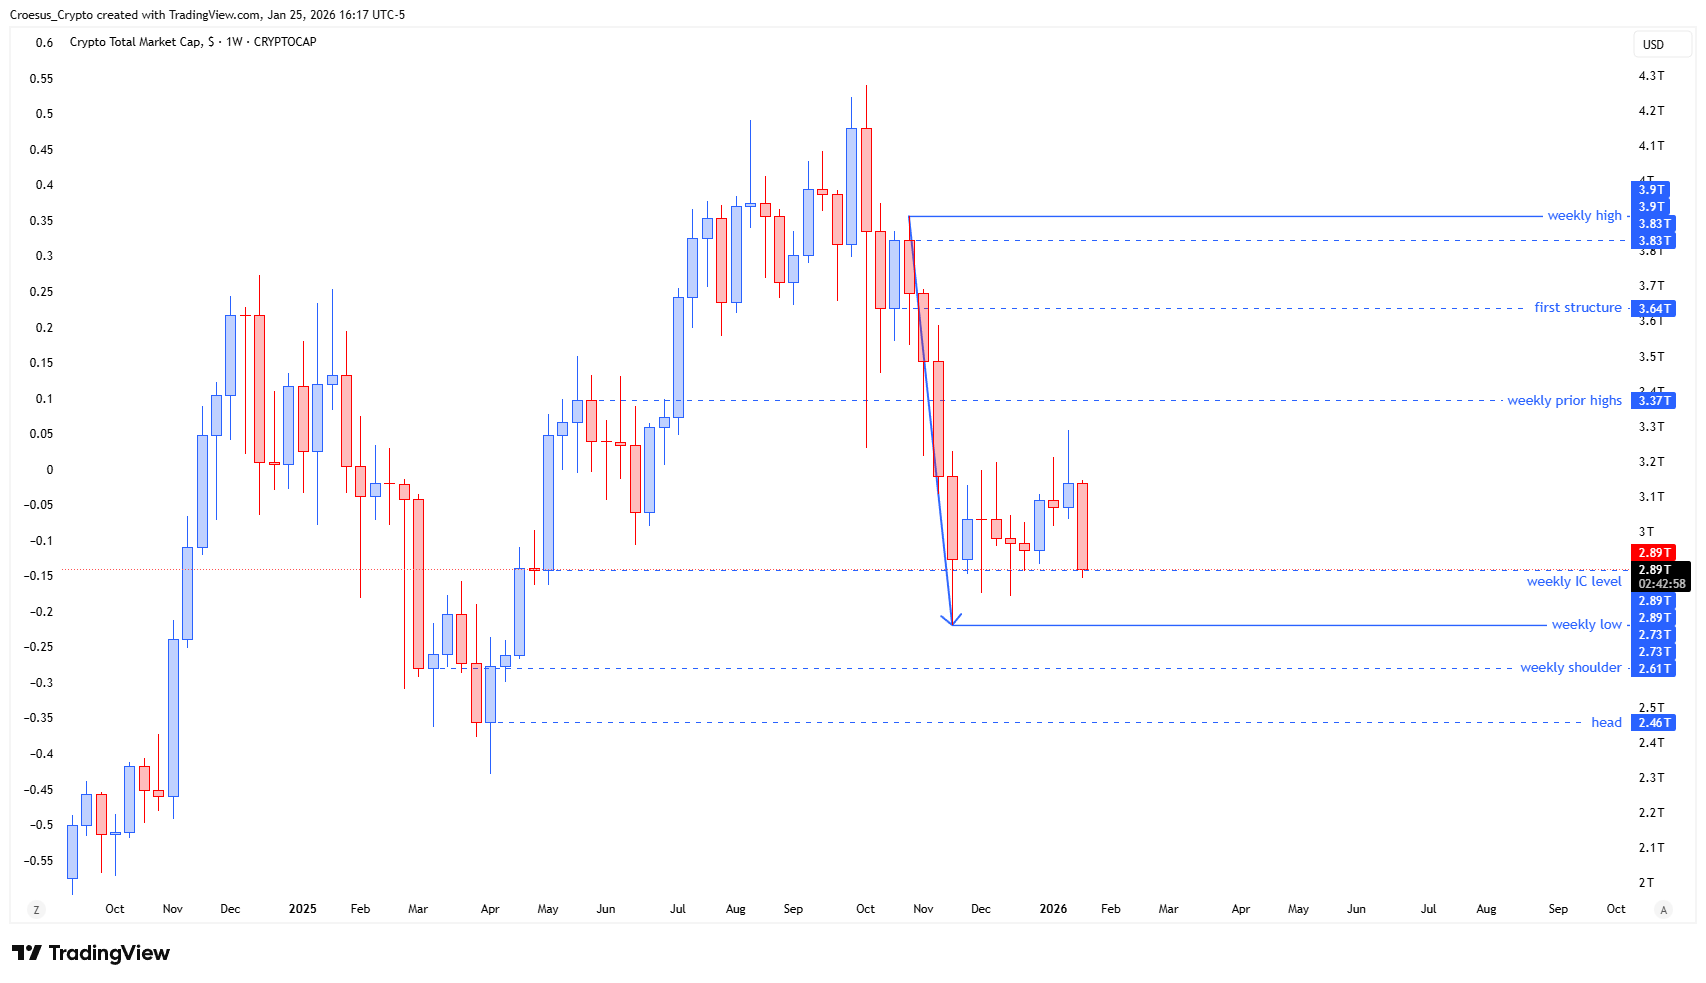
- We can clearly see a retest of the lows this week. Even quite aggressive.
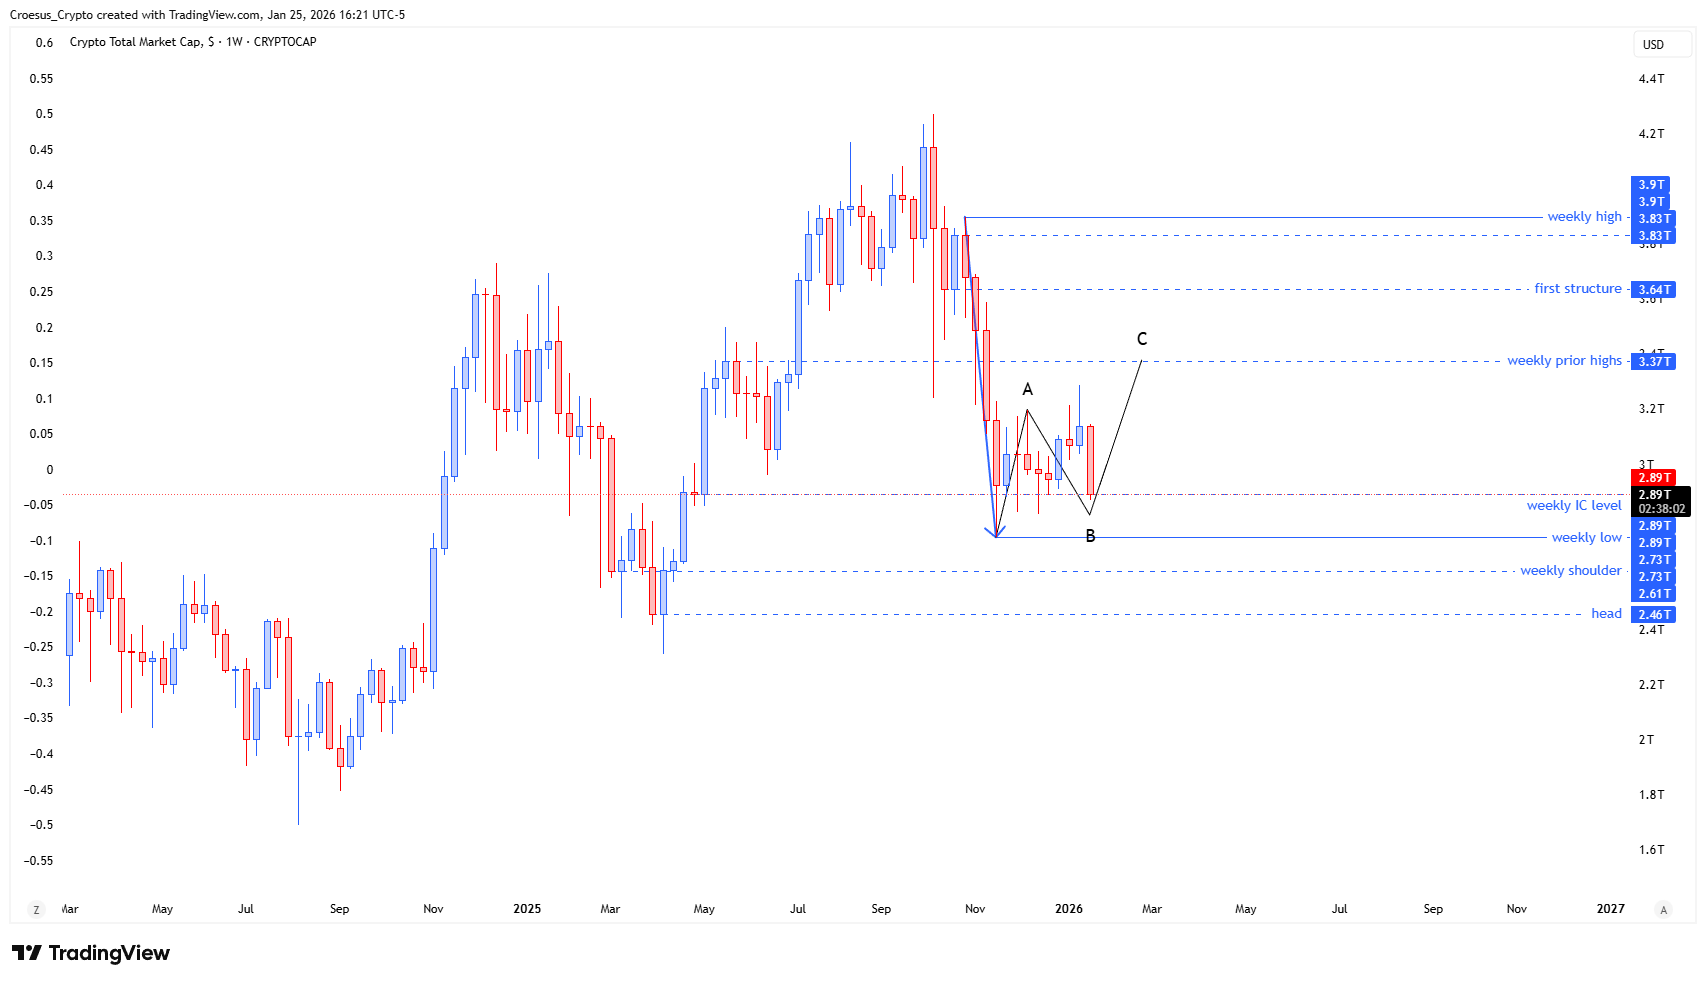
- But this move still fits in a possible ABC-correction of the strong bearish impulse. With this move we might be printing the B, but the index can still move lower within the fake out zone. That is why that a weekly close below the 2.73T weekly low is our invalidation level of this set-up.
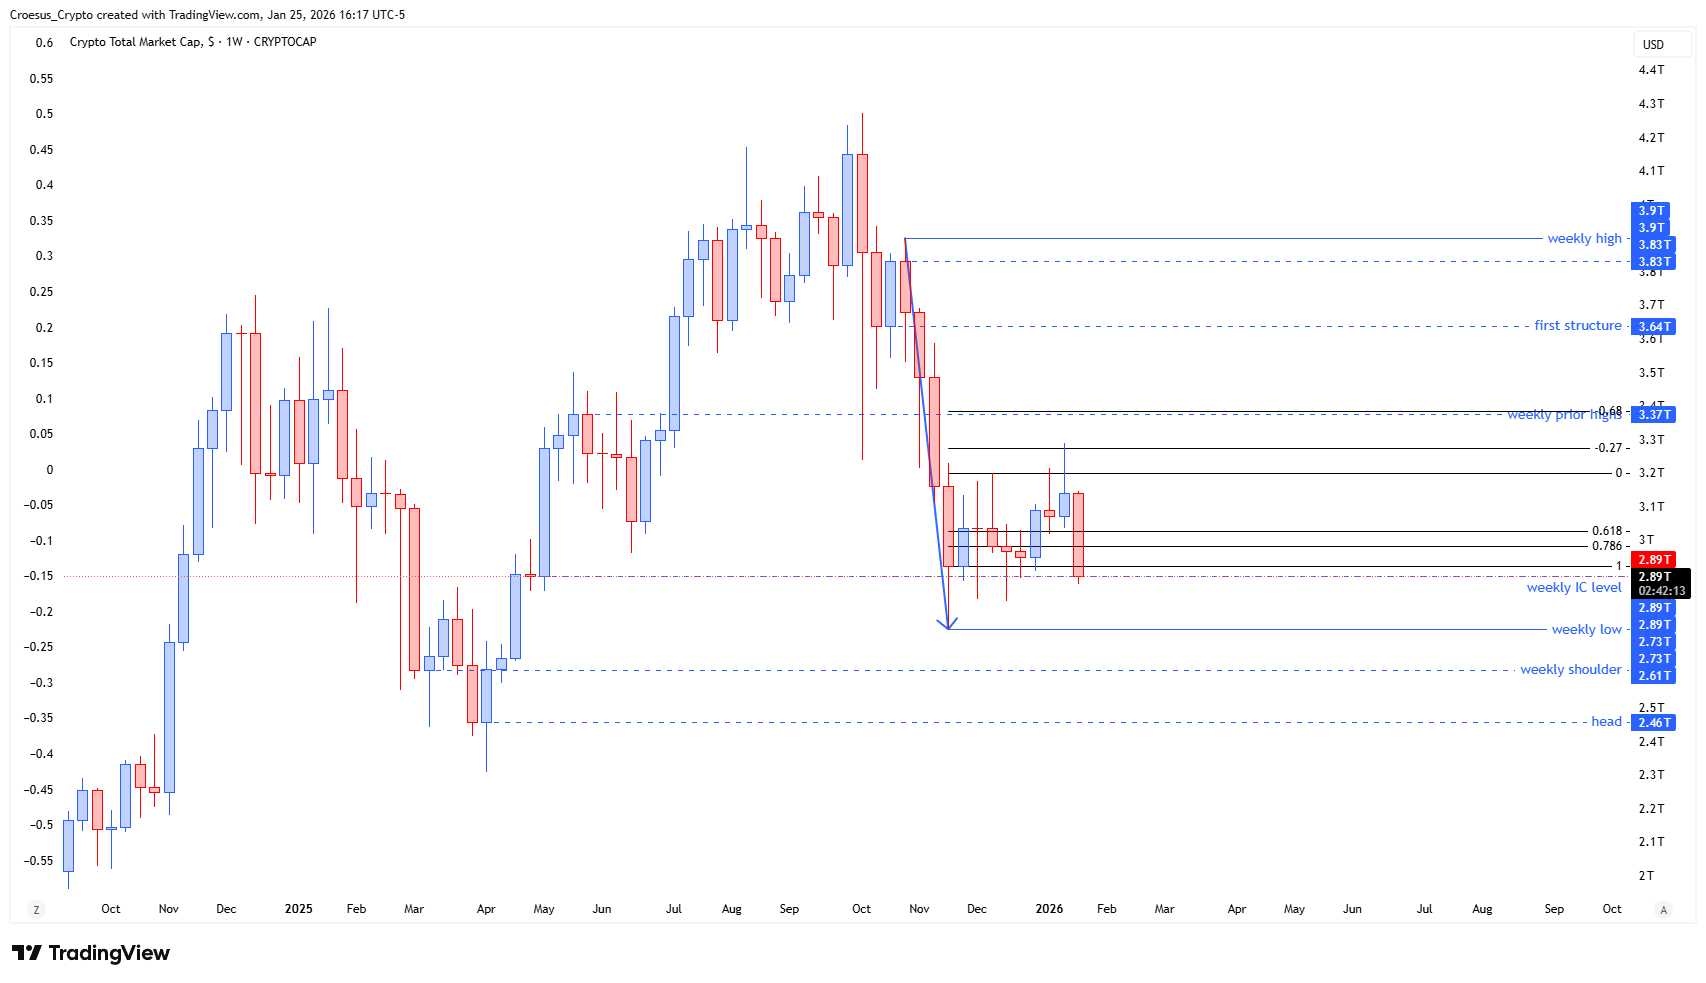
- If we see a reversal this week of during the coming weeks, we could see the price surge to the -0.68 fib extension level of the A-leg of the ABC-correction. Which coincides with prior highs.
Market Structure Analysis
From a market structure perspective, TOTAL weekly analysis continues to revolve around whether the current downswing is an extension of the bearish impulse or a corrective leg inside an ABC-correction. The aggressive retest of the lows reads as a liquidity probe: price is testing the range low area and attempting to shake out weak positioning.
Structurally, the key point is invalidation: a weekly close below the 2.73T weekly low would confirm the breakdown and invalidate the corrective thesis. Until that happens, the move can still be interpreted as a “B” leg that briefly dips into a fake out zone before a reversal attempt.
The Fibonacci reference (-0.68 fib extension of the A-leg) frames a potential upside magnet that also aligns with prior highs, making it a logical resistance objective if a reversal develops.
Key Levels and Scenarios
For TOTAL weekly analysis, the bearish scenario strengthens on acceptance below the weekly low, while the bullish corrective scenario requires a reversal that holds above invalidation and then reclaims nearby support resistance to target the Fibonacci extension zone.
- 2.73T weekly low: weekly close below this level invalidates the ABC-correction setup
- “Fake out zone” under/around the lows: area where breakdowns can fail and reverse
- -0.68 fib extension of the A-leg: upside objective if the reversal scenario triggers
- Prior highs (resistance): confluence area with the -0.68 fib extension zone
Trading Implications
Risk is currently concentrated around the weekly low: aggressive participants may look for reversal confirmation, while conservative traders typically wait for a clear reclaim and higher-low structure. If price closes below invalidation, downside continuation becomes the primary structure to respect.
This analysis is for informational purposes only and does not constitute financial advice.