

TOTAL weekly chart week 47 with -1 Fibonacci target and weekly institutional level
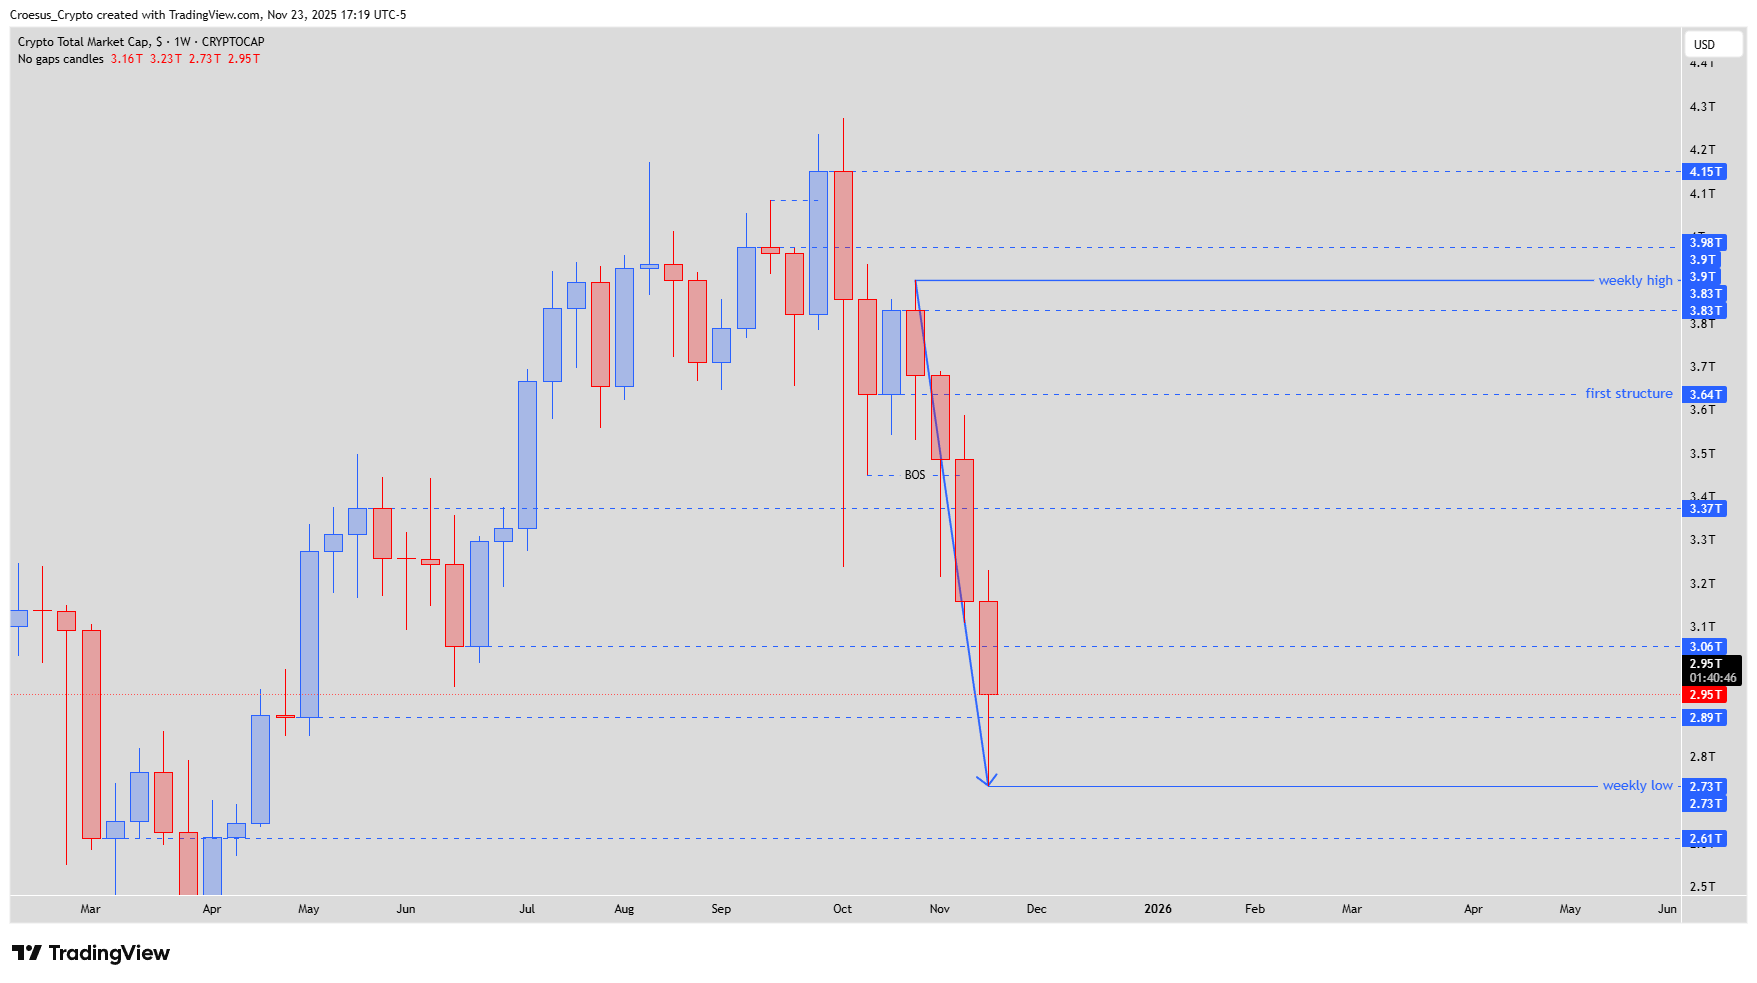
TOTAL weekly chart – Week 47 2025 showing bearish leg down into weekly low and reaction
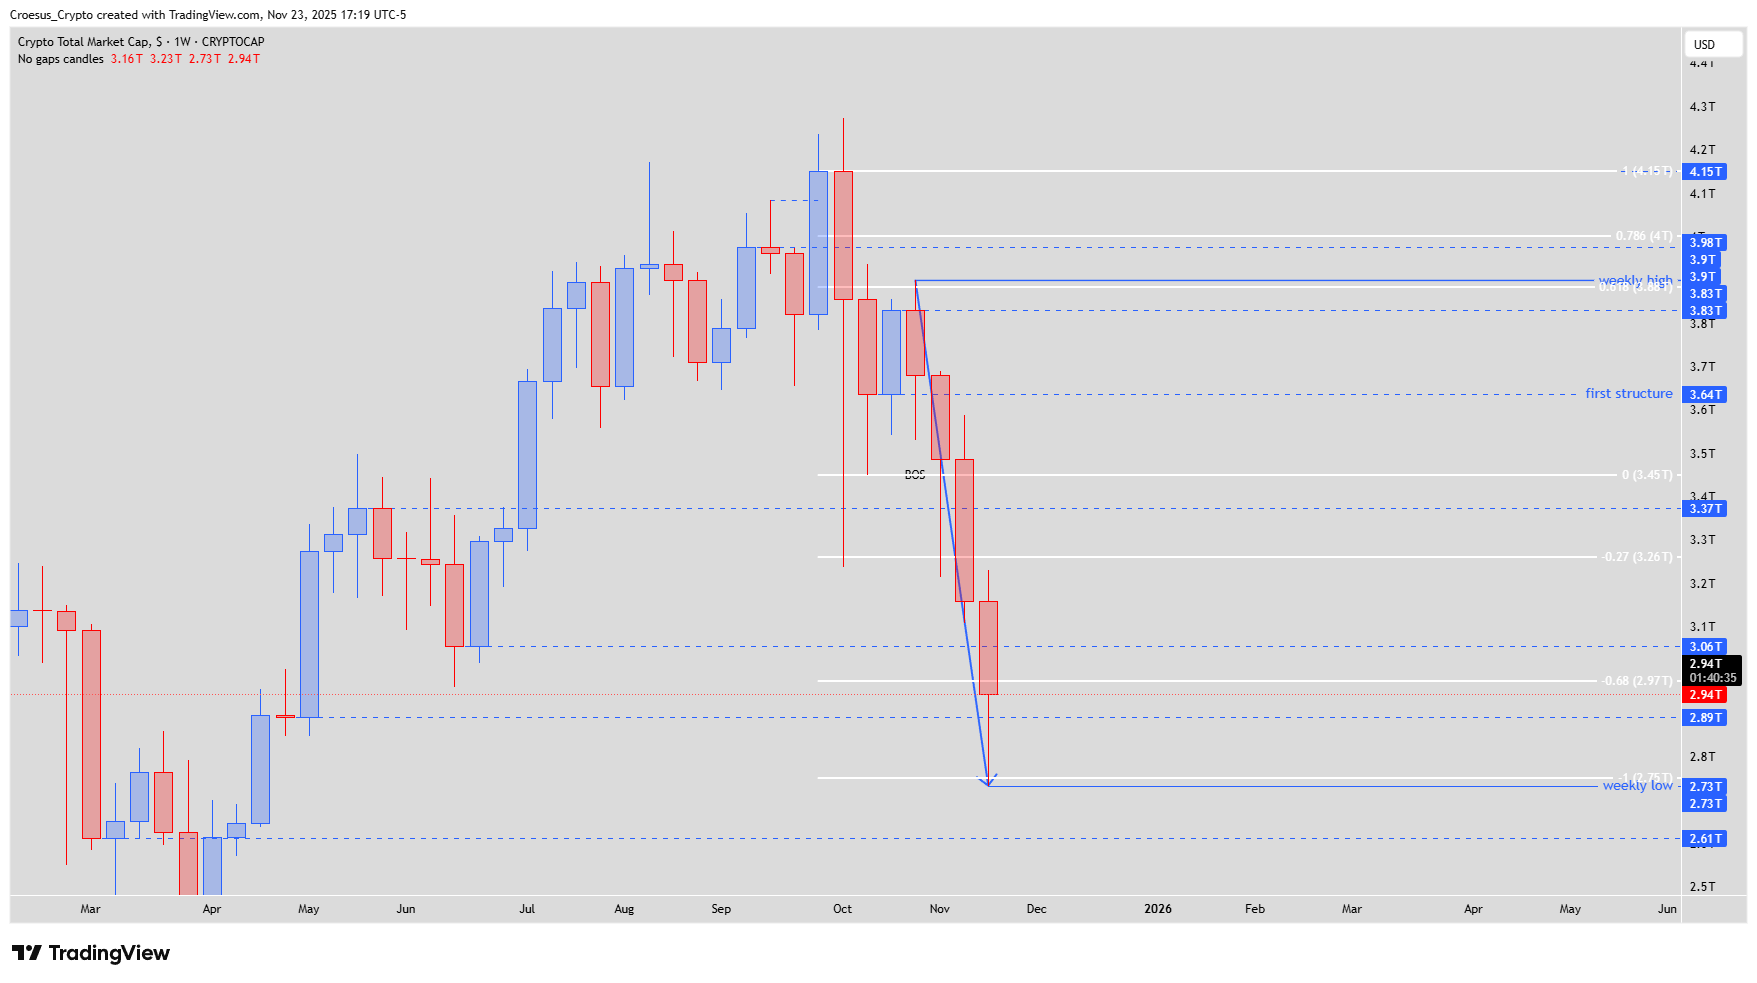
- Bears kept pushing down this week, but finally hit the fib level -1. The index also reached a weekly level created by a small institutional candle.
- The index reacted bullish at the end of the week and during the weekend.
- As noted last week there is still no slowing down of the price on the weekly timeframe. Still waiting for the first bullish candle in weeks.
- Take into account : even when we see a bullish relief, the index is still in a bearish leg down.
Market Structure Analysis
From a market-structure perspective, this TOTAL weekly analysis confirms strong downside momentum: multiple consecutive red candles driving price into a confluence of Fibonacci extension and a weekly institutional level. That area now behaves as key support within our technical analysis framework, but the reaction so far is only a wick and small relief, not a confirmed shift in structure.
We still lack a clear bullish weekly candle or break of any recent lower high, so the dominant swing remains a bearish impulse. Any bounce from this zone currently reads as corrective price action within that leg, not yet a full reversal.
Key Levels and Scenarios
Bullish scenario: a sustained relief rally from this weekly level could drive price back toward prior breakdown areas, where we expect renewed supply and potential support resistance flip zones. Confirmation would require at least one strong bullish weekly close and a break in the sequence of lower highs.
Key elements to watch:
Reaction around the -1 Fibonacci extension
Respect or loss of the weekly institutional level
First decisive bullish weekly candle after the current series of red candles
Structure of any relief move relative to the existing bearish leg
Trading Implications
Given the intact bearish leg, any long exposure here is countertrend and should use conservative position sizing, clear invalidation below the current reaction zone, and tight risk management until weekly structure actually turns.
This analysis is not financial advice; always do your own research and manage your risk before trading.