

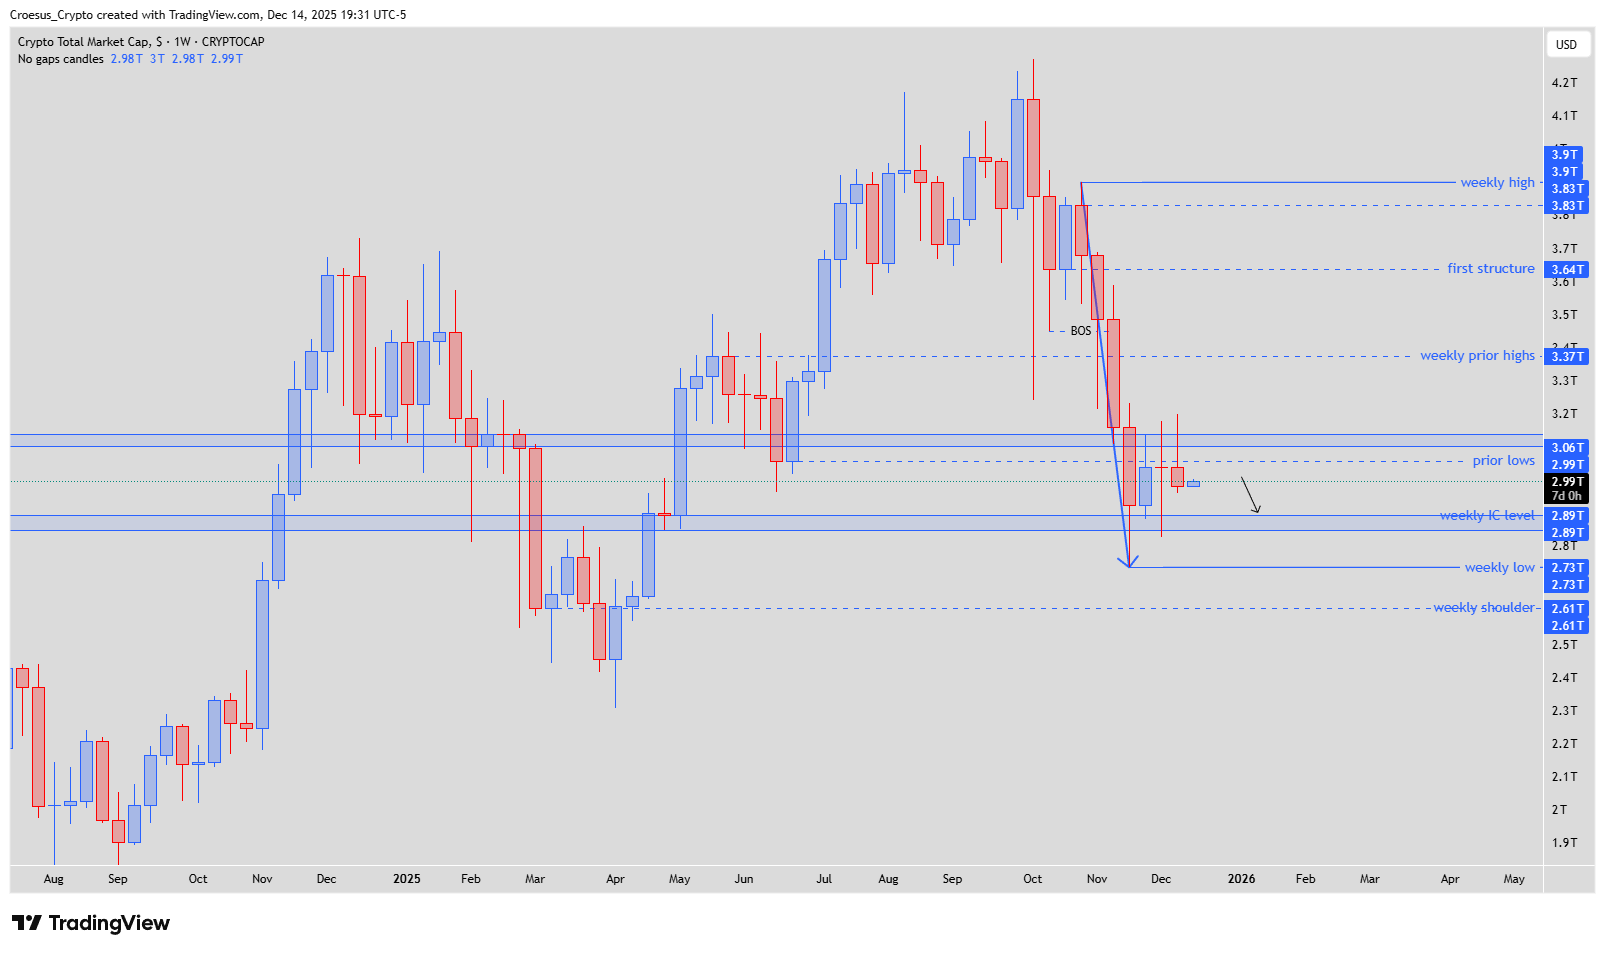
In this TOTAL weekly analysis for Week 50, we see the index closing with a clear swing failure at the weekly institutional candle and the prior lows. Our technical analysis suggests that this rejection shifts the focus toward liquidity lower, into the next demand zone, before a potential corrective push higher.
TOTAL weekly chart Week 50 showing swing failure at weekly institutional candle, path toward lower demand zone and projected ABC move to 3.37T.
Technical Analysis Key Points
- This week, we saw the index close with a clear swing failure, rejecting both the weekly institutional candle and the prior lows.
- This suggests that the index will first look for more liquidity lower, retesting the lower demand zone.
- This would fit into the plan of an ABC correction of the impulsive bearish move down, where this week’s swing high has just printed the A leg.
- When retesting the demand zone, we should then be printing the B leg.
- The target of this ABC correction is the weekly prior highs at 3.37T. Once price reaches that area, we could see a bearish continuation.
Market Structure Analysis
This TOTAL weekly analysis shows a clean rejection at a key support resistance flip: the weekly IC level aligns with prior lows, and the swing failure there signals that sellers are still in control.
The impulsive leg down defines the broader bearish trend, while the developing ABC structure acts as a corrective phase within that trend.
A move into the lower demand zone would complete wave B and potentially set up a retracement toward the weekly prior highs around 3.37T for wave C.
Fibonacci retracements can help refine the B–C leg, but the main focus remains how price behaves at the demand zone and at 3.37T.
Key Levels and Scenarios
Bullish corrective scenario:
If buyers step in at the lower demand zone and defend it on a weekly closing basis, we expect a corrective rally (C leg) toward the weekly prior highs at 3.37T before any larger bearish continuation.
Key levels to watch
Weekly IC level / swing-failure zone: current rejection area and key support resistance.
Lower demand zone: expected next liquidity grab; potential B-leg low.
3.37T weekly prior highs: main ABC correction target and probable supply zone.
Current week’s swing high: invalidation for deeper immediate downside if reclaimed quickly.
Trading implications
From a risk/reward perspective, the cleaner setups may appear either at the lower demand zone (for a tactical long into 3.37T) or near 3.37T (for bearish continuation trades), with position sizing kept modest until weekly closes confirm direction.
This analysis is for educational and informational purposes only and is not financial advice. Always do your own research and make your own trading decisions. Trading and investing in crypto assets involve significant risk, including the risk of loss of capital.