

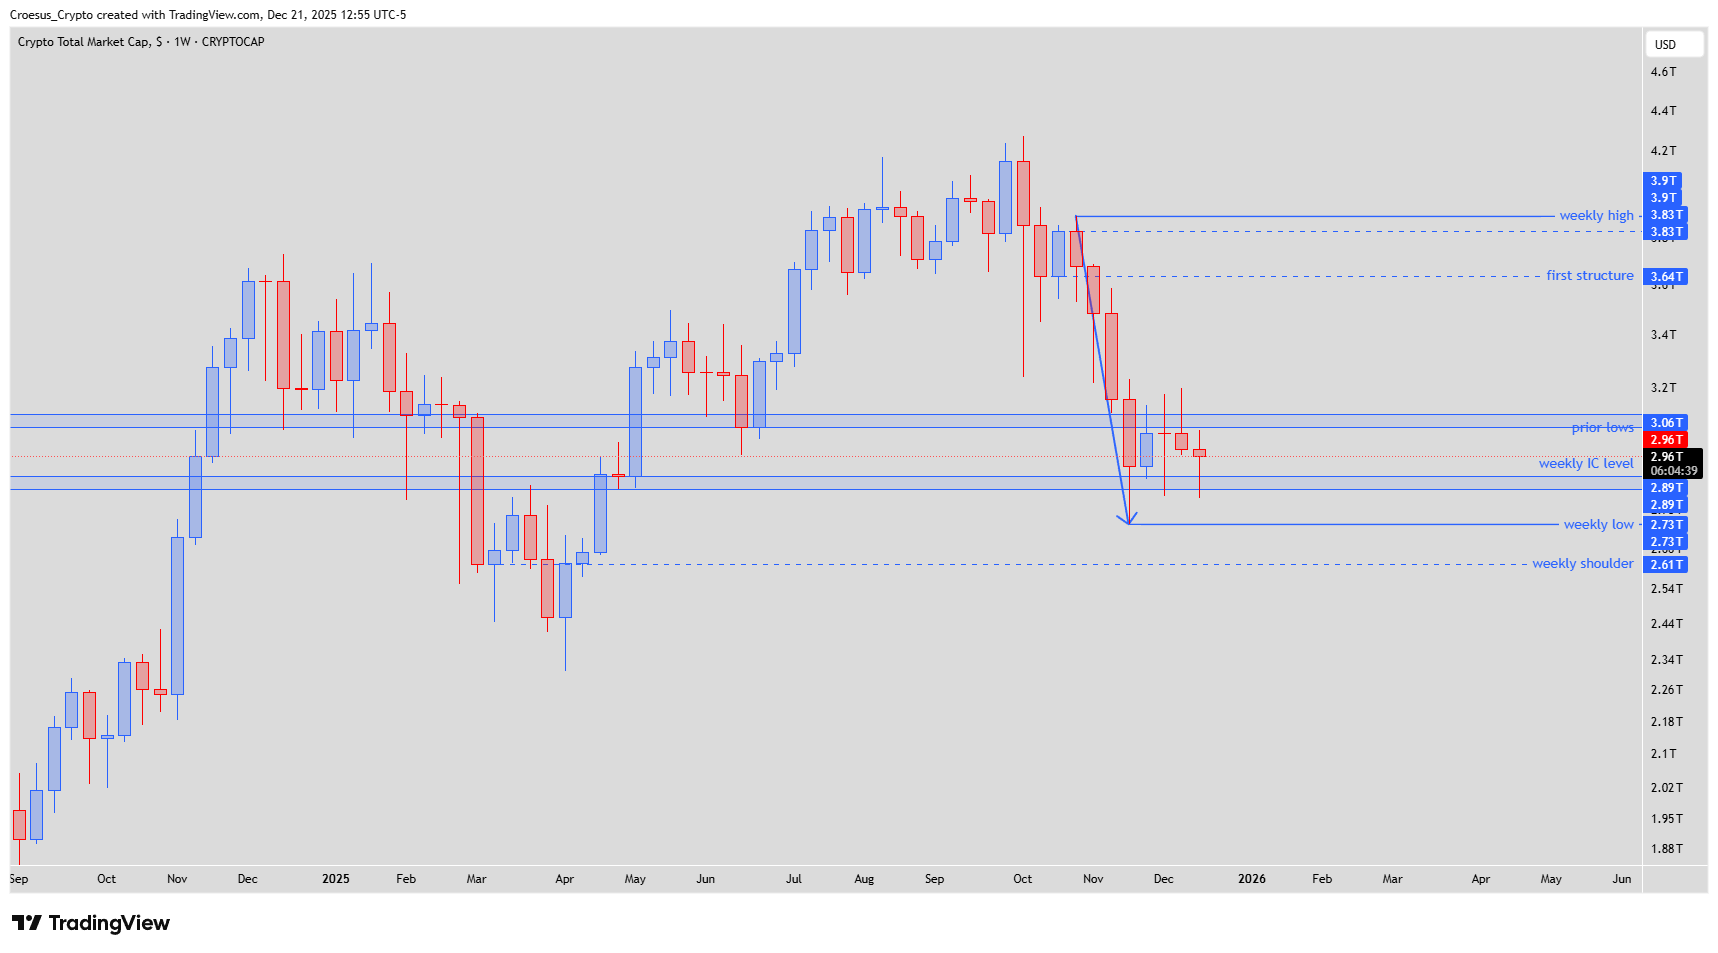
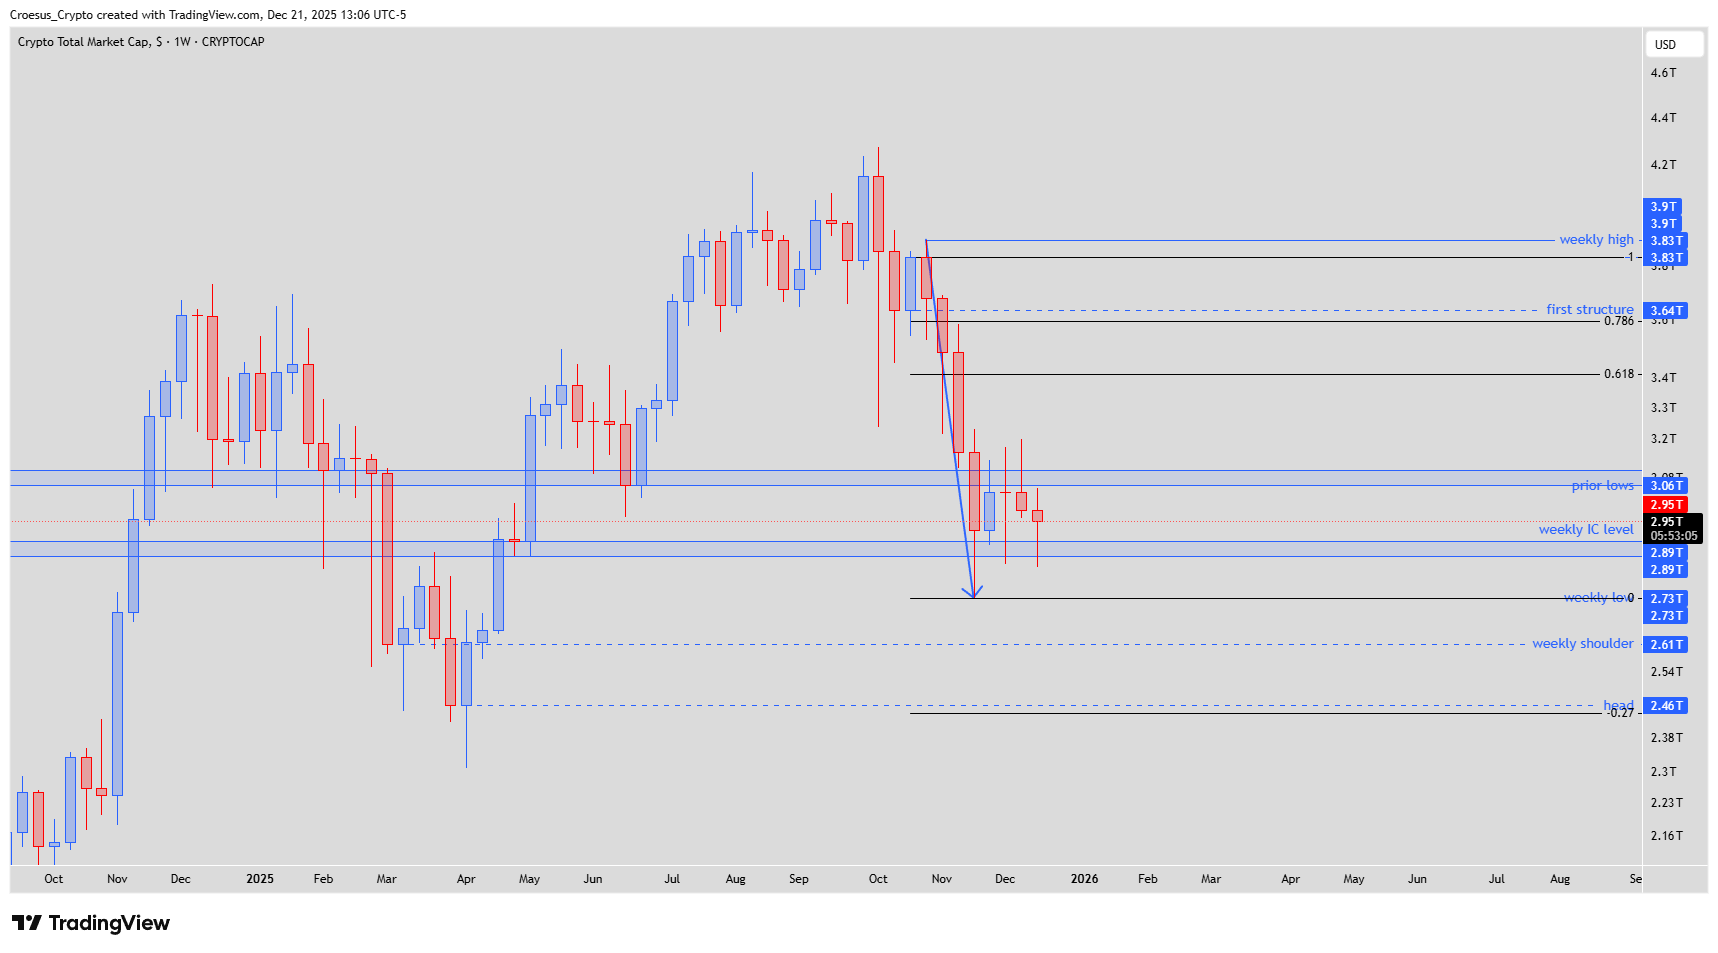
On the TOTAL weekly timeframe our analysis focuses on the November 2025 sell-off into the IC-level and the subsequent consolidation between that support and the prior lows around 3.06T. This TOTAL weekly analysis highlights a neutral, undecided market where both bullish ABC correction and bearish continuation structures remain valid within the current range, fully in line with the Croesus naked-chart methodology.
Technical Analysis Key Points
- The index made a sharp sell-off in November 2025, into the IC-level
- The bullish bounce up was short lived because it found resistance in the prior lows at 3.06T.
- This could go both ways :
- bullish : this could be an ABC correction of the bearish push-down. This would mean that we would see a bullish reversal pattern on a strong level. Neither on the monthly nor the 3M is there a keylevel at this moment in play.
- bearish : the consolidation between both levels could be a natural bearish W as we have tested and retested the lows now and already tested the highs. This means we need to retest the highs again. This would mean we could retest either the lower weekly shoulder level or even the head.
Market Structure Analysis
Market structure is currently defined by the sharp November impulse down into the weekly IC-level, followed by a failed bounce that stalled exactly at the prior lows near 3.06T. That prior low now acts as clear resistance, while the IC-level is the primary support.
The sideways price action between these bands creates an indecisive range that can morph into
- either an ABC corrective pattern higher
- or a bearish W continuation lower.
From a technical analysis and Fibonacci perspective, traders will anchor retracements to the November leg and watch whether any bounce can sustain above typical retracement zones around the prior lows, which would strengthen the bullish ABC case; continued rejection there keeps the bearish structure in control.
Key Levels and Scenarios
Bullish scenario: buyers defend the IC-level, form a clear reversal pattern (higher low or strong engulfing weekly candle) and break back above 3.06T, opening room for an ABC corrective leg higher and a broader recovery in total crypto market cap.
Key levels to watch:
3.06T – prior lows, key weekly resistance that must be reclaimed for bullish confirmation
Weekly IC-level – current support and pivot for the entire range
Weekly low zone – loss of this zone confirms renewed downside momentum
Weekly shoulder level – deeper bearish target if the range resolves down
Head level – final downside liquidity target if the bearish W structure plays out fully
Trading implications
For active traders, this is a wait-for-confirmation environment: aggressive entries around the IC-level require tight risk management, while conservative traders may prefer to react only to a weekly close outside the IC–3.06T range before positioning size.
This analysis is for educational and informational purposes only and is not financial advice. Always do your own research and make your own trading decisions. Trading and investing in crypto assets involve significant risk, including the risk of loss of capital.