

TOTAL weekly analysis for week 52 December 2025 focuses on a possible corrective bottom forming after a very impulsive bearish leg down. Our technical analysis suggests that, while we may see a temporary bullish bounce, the primary structure still points to a dominant bearish trend.
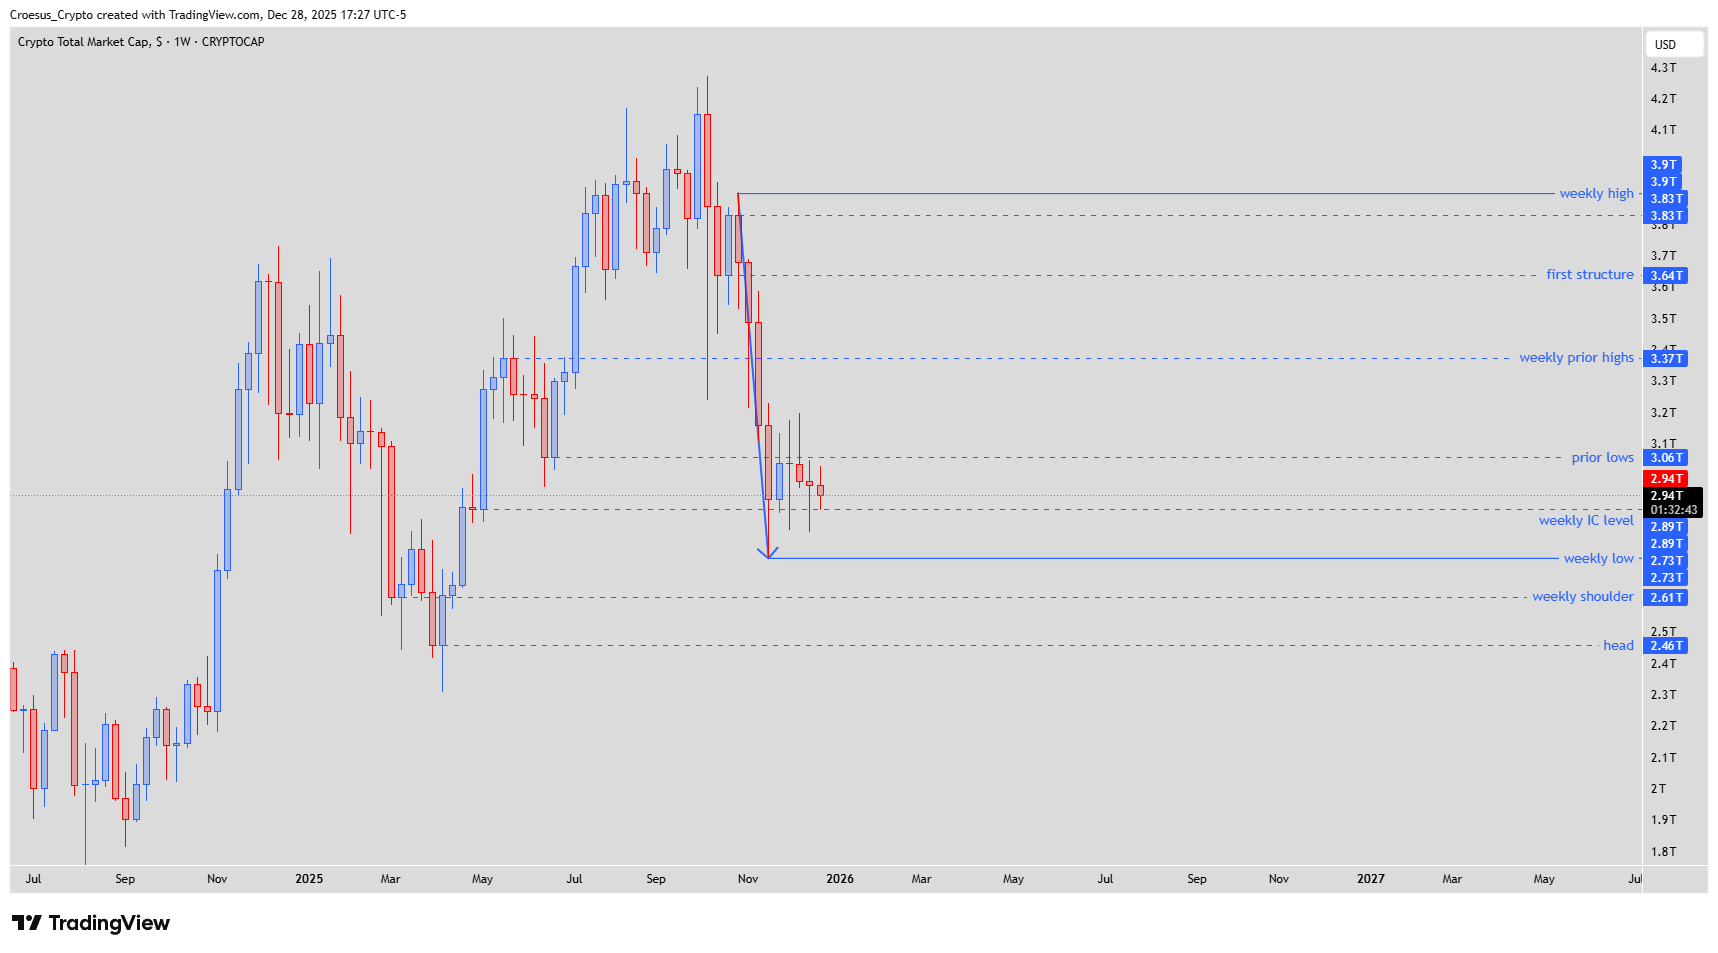
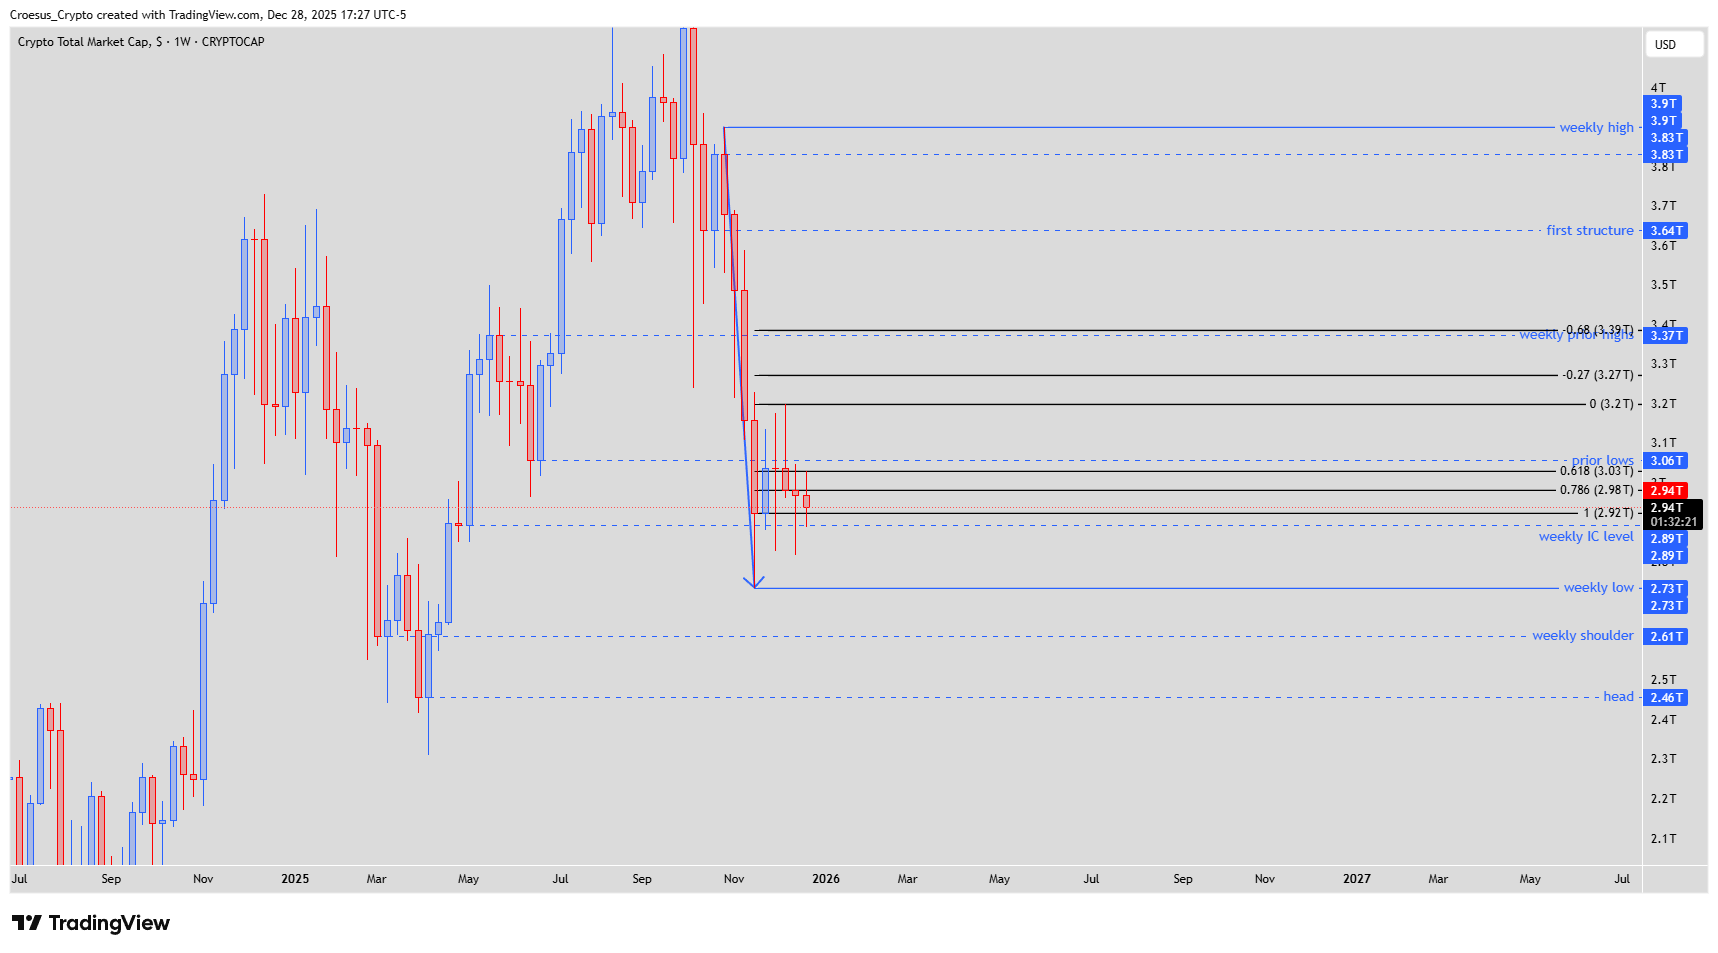
TOTAL weekly chart week 52 December 2025 zoomed out, showing bearish impulse, potential ABC correction and major weekly support resistance zones.
Technical Analysis Key Points
- After a very impulsive bearish move down, we can see a bottoming pattern develop.
- After the first bullish candle, we could see the next four weeks a correction of that bullish candle.
- This could be a beginning of an ABC correction, setting possibly the stage of a further correction of the bearish impulse down.
- REMARK : this possible bullish move is to be considered as a correction of the bearish leg down. The predominant trend is still bearish.
- REMARK 2 : Look at the lower timeframes (daily or 4H) for bullish reversal patterns. The index can still correct in the fake zone (the zone between the weekly low and the candle close). A close below the current weekly level but above the weekly low, could give us a fractal inverse head and shoulder set-up.
Market Structure Analysis
Our weekly technical analysis shows a sharp bearish impulse followed by a potential bottoming formation, with several small-bodied candles retracing the first strong bullish reaction. This aligns with the early stages of an ABC correction within a larger downtrend.
The weekly low acts as major support, while the current weekly close zone (“fake out zone”) is interim support/resistance. Above, prior weekly lows and the first structure area form key resistance where the bearish trend could reassert. The 0.618–0.786 Fibonacci retracement band of the last impulse overlaps with these prior lows, adding confluence for a corrective rally to stall there. Overall market structure remains bearish unless weekly candles start closing convincingly above these resistance zones.
Key Levels and Scenarios
Bullish scenario (corrective):
If buyers defend the weekly low and we see higher lows on the daily or 4H with clear bullish reversal patterns (for example a fractal inverse head and shoulders in the fake zone), an ABC corrective rally toward the weekly close / imbalance and prior weekly lows becomes likely, still within a broader bearish leg.
Key levels to watch:
Weekly low zone: Primary support and invalidation of the short-term bullish correction if lost.
Current weekly close / IC level: First resistance and main magnet for an ABC wave A/B.
Prior weekly lows: Major resistance and potential completion area of the corrective structure.
First structure / weekly prior highs: Extended target if correction extends beyond the initial resistance band.
Trading implications
For active traders, the focus is on tactical long setups only on lower timeframes with clear confirmation, tight stop losses below the weekly low, and conservative position sizing given the dominant bearish trend and corrective nature of any upside move; short-biased swing trades remain valid near higher resistance zones.
This analysis is for educational and informational purposes only and is not financial advice. Always do your own research and make your own trading decisions. Trading and investing in crypto assets involve significant risk, including the risk of loss of capital.