

TOTAL Marketcap / Crypto Total Market Cap
TOTAL weekly analysis for week 7 February 2026 highlights a market that is still in a bearish leg but starting to show signs of potential bottoming, based on price action, support resistance and Fibonacci confluence rather than indicators
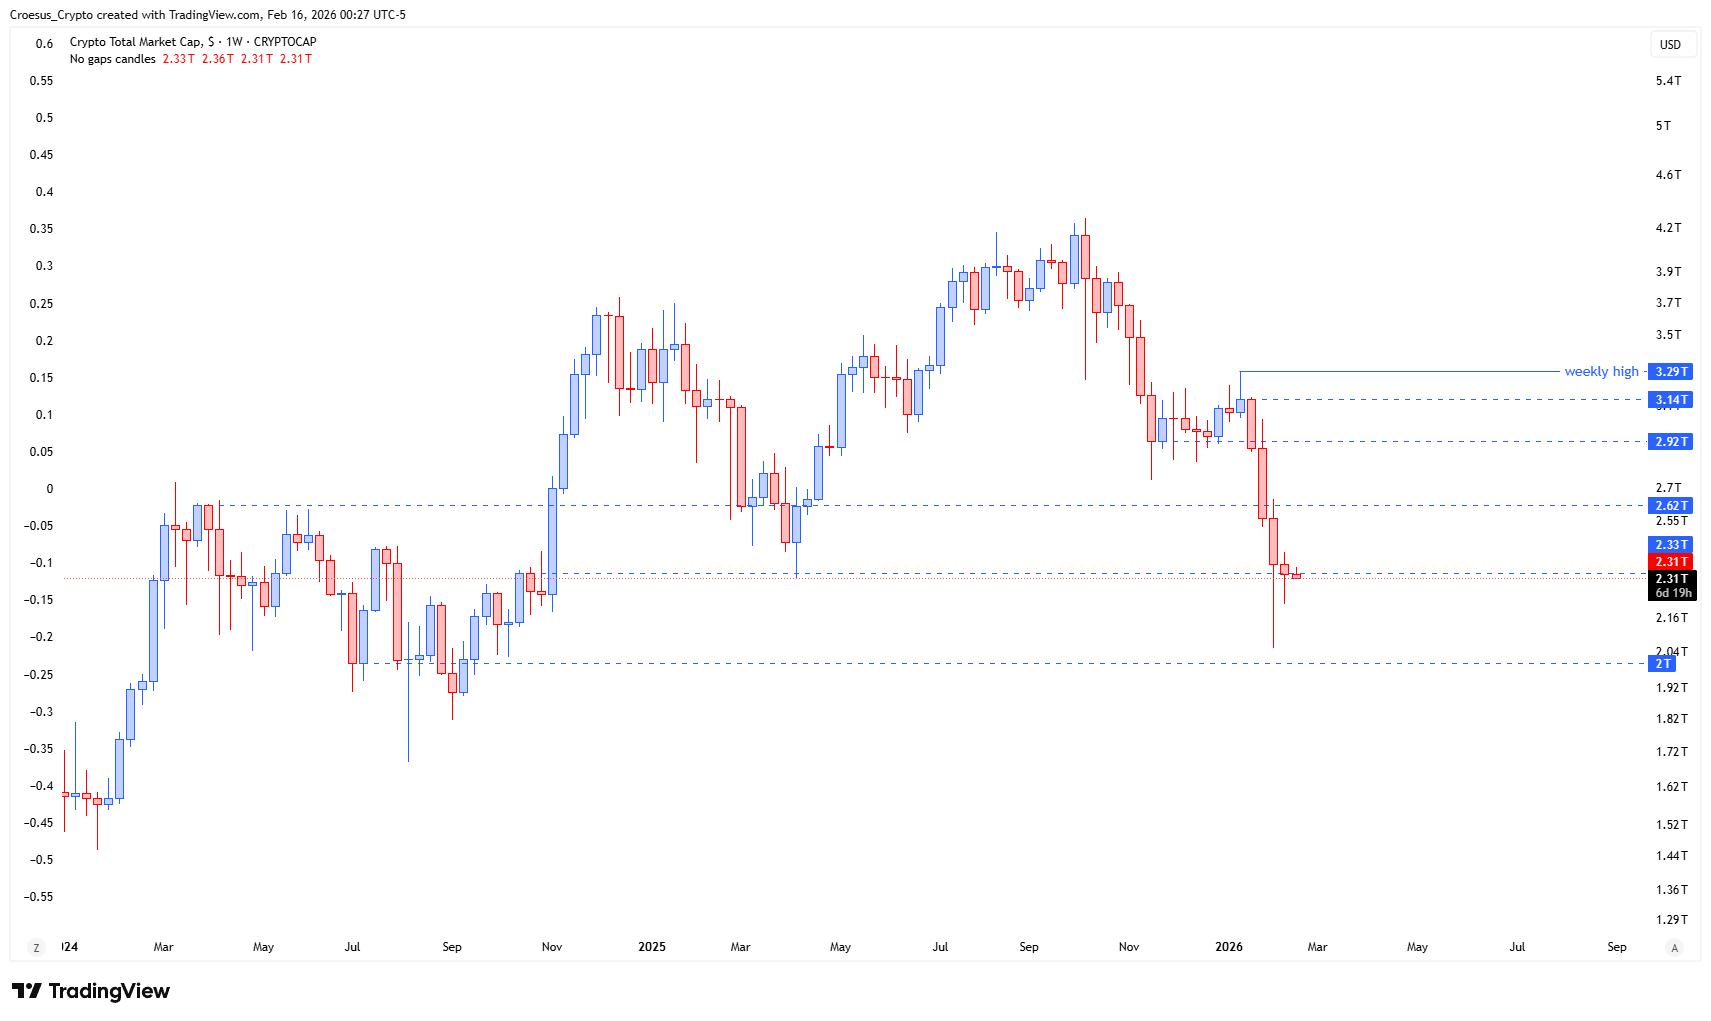
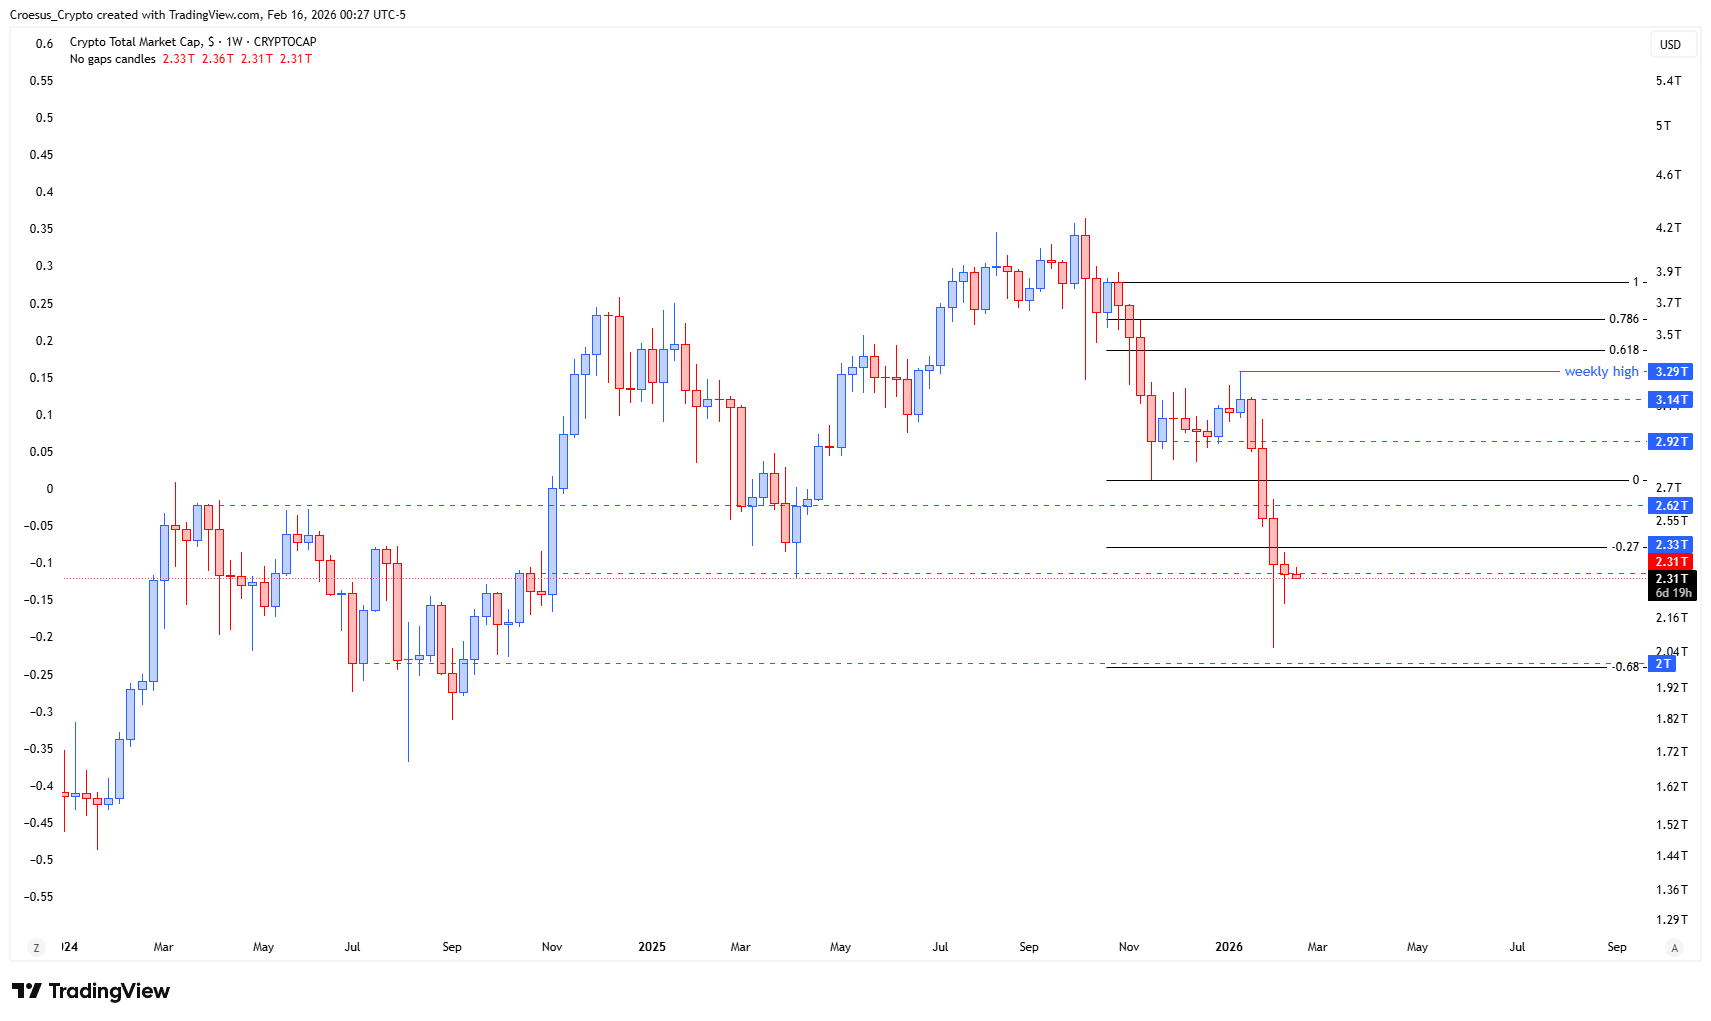
- The bearish impulsivity is slowing down on TOTAL, indicating us a potential bottoming.
- Eventhough we can not see a reversal yet, we can clearly see a long wick where TOTAL recovered quite quickly and last week we didn't close below the low of the previous candle, indicating us that bulls and bears are agreeing on this level for the moment being.
- But, as we already know from the past, a momentum retest can be confirmed with a structural retest.
- The weekly candle closed below a weekly level.
Market Structure Analysis
Our technical analysis suggests the dominant move on TOTAL remains a bearish impulse, but momentum is clearly waning. The long lower wick and failure to close below the prior weekly low show that sellers are losing follow-through and that a temporary agreement zone between bulls and bears has formed. This often precedes either a consolidation base or a more complex corrective structure.
Price has just closed back below a key weekly level, turning it into immediate resistance and confirming that any bounce from here still trades within a corrective context. However, the structural picture remains interesting: the Fibonacci extension “-0.68” lines up with the 2T zone, which also corresponds to the shoulder level of a larger inverse head and shoulders. That kind of Fibonacci and structure confluence often marks medium-term inflection points where trend exhaustion and new cycles can begin.
Key Levels and Scenarios
Bullish scenario: if buyers manage to defend the 2T region (Fib -0.68 and inverse H&S shoulder support) and reclaim the broken weekly level above, we would expect a structural retest higher and an increased probability that the larger inverse head and shoulders completes toward prior weekly highs.
Key levels to watch:
- 2T area – Fib -0.68 extension and inverse H&S shoulder support; key potential bottoming zone.
- Current agreement zone – region around last week’s low/high where candles are overlapping, signaling short-term balance.
- Broken weekly level above price – first resistance to reclaim to confirm any sustainable recovery.
- Previous weekly high – upside validation level if the inverse head and shoulders scenario starts to play out.
Trading Implications
For active traders, this remains a corrective, high-risk environment: aggressive participants may look for evidence of absorption and higher-low structures around 2T, while conservative traders typically wait for a clean weekly close back above the broken level before sizing into longer-term positions or setting tighter invalidation below the confluence zone.
This analysis is for informational purposes only and does not constitute financial advice.