

TOTAL Marketcap / Crypto Total Market Cap
In this TOTAL weekly analysis week 8 February 2026, we review how the total crypto market cap continues to bleed lower after January’s steep impulse down. Our technical analysis focuses on the large downside wick formed on the weekly chart and the ongoing structural retest that is unfolding around it, with price now hovering near 2.21T between the 3.29T weekly high and the 2.05T weekly low.
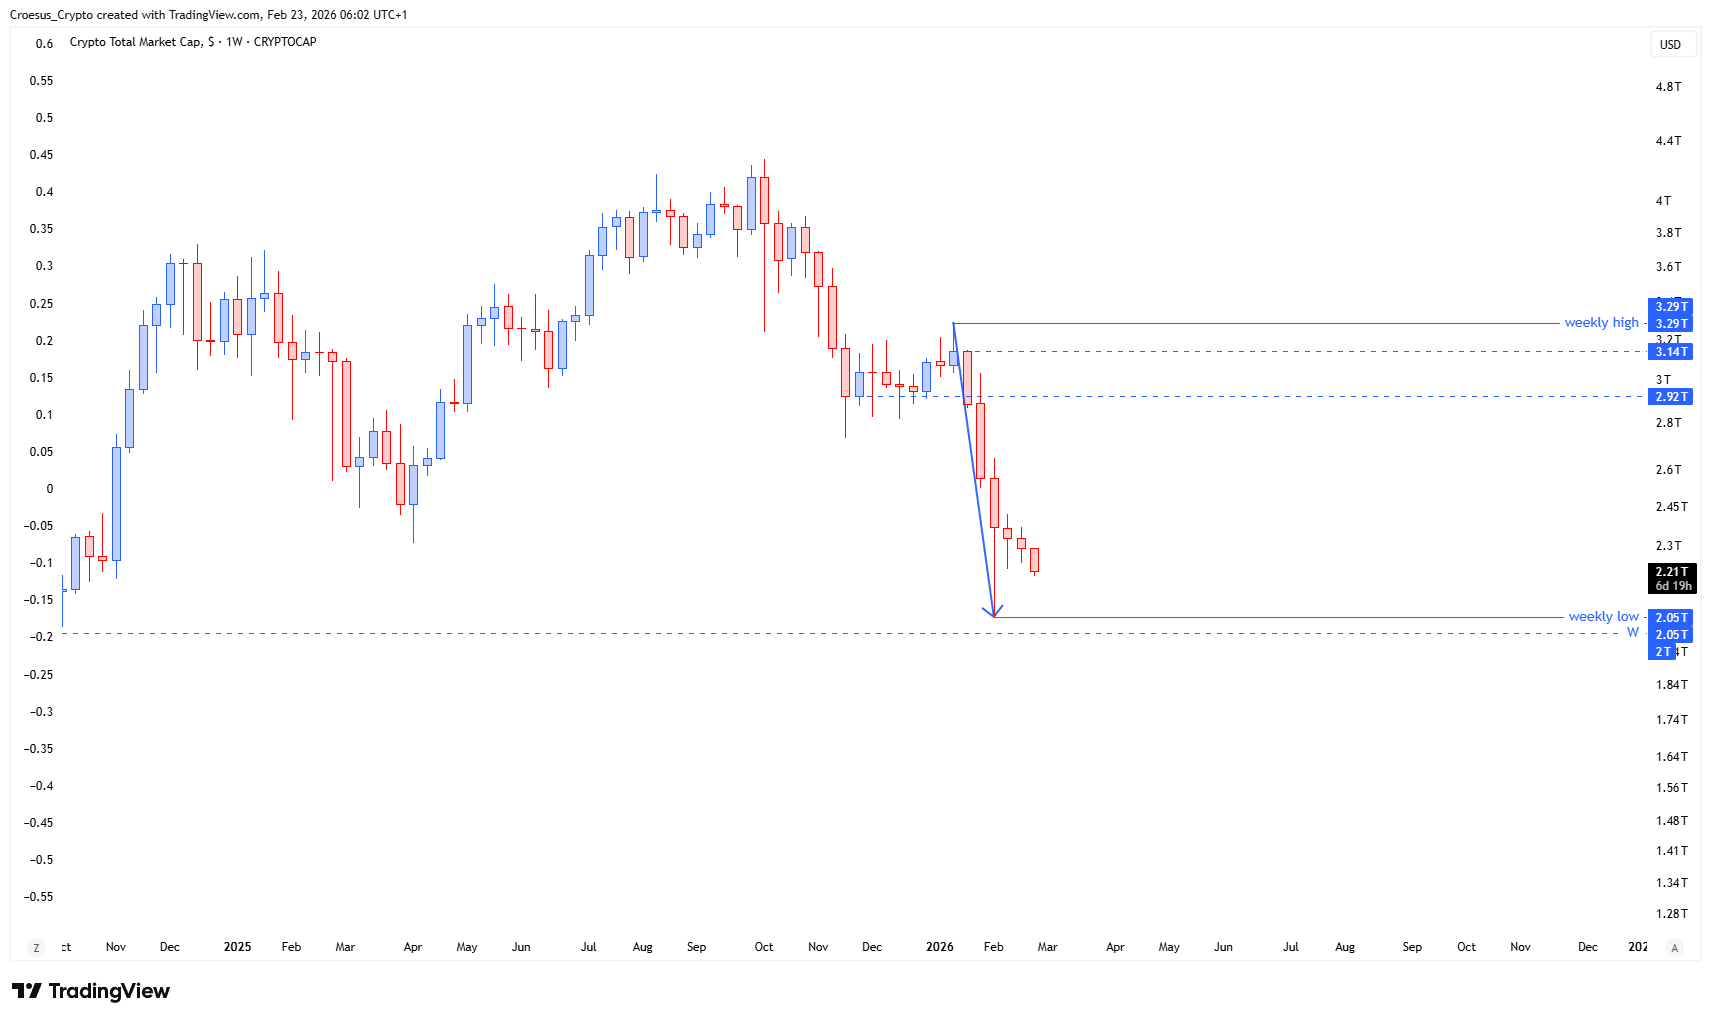
- This weekly analysis confirms the previous analysis. After a momentum retest with a long wick, we see a further gradual structural retest of this wick.
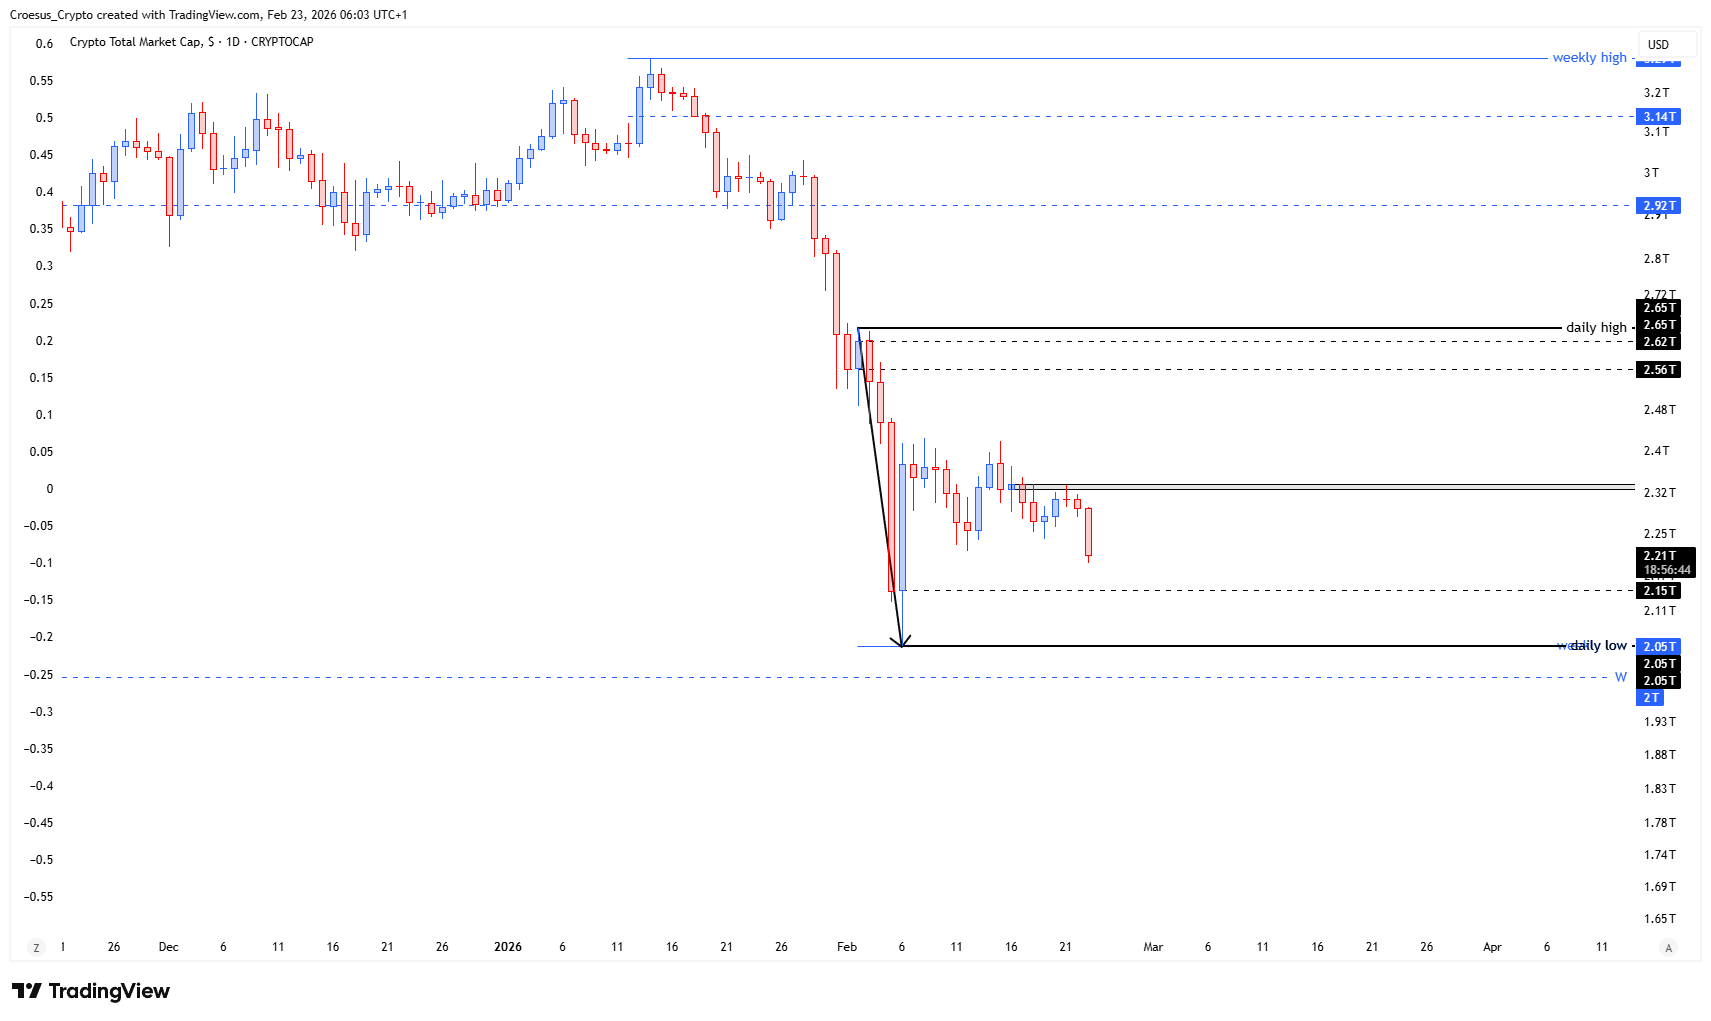
- Eventhough this is not a daily analysis, we would like to zoom in on this chart. We can see a further decline, but an ABC correction remains still in play
Market Structure Analysis
Our TOTAL weekly analysis shows a clear sequence: a strong vertical sell-off, a sharp wick into the 2.05T weekly low, and now a slower grind back into that wick. This confirms that supply is still dominant, but the character of the move has shifted from impulsive to corrective. On the daily chart, price trades below the 2.32T–2.56T band, turning that zone into a key support resistance flip. As long as candles close below 2.32T, the “C” leg of the ABC correction on the daily can still extend toward or fractionally through the 2.05T weekly low. No specific Fibonacci confluence is highlighted, but traders can overlay Fibonacci tools on the latest impulse to refine their own levels within this corrective structure.
Key Levels and Scenarios
Bullish scenario: if buyers defend the 2.05T weekly low and reclaim 2.32T, an ABC correction completion could trigger a squeeze back into the 2.56T and potentially 2.92T–3.14T range, implying substantial upside from the lows.
Key levels to watch:
- 3.29T weekly high – major resistance and top of the current range.
- 3.14T prior weekly level – intermediate resistance inside the upper range.
- 2.92T mid-range level – first bigger upside target if momentum flips.
- 2.21T current area – short-term pivot where the structural retest is unfolding.
- 2.05T weekly low – critical support; loss of this level opens deeper downside.
Trading Implications
For active traders, the risk/reward skews around how price reacts near 2.05T: conservative participants may wait for a confirmed reclaim of 2.32T before sizing into longs, while aggressive bears can frame shorts against the 2.32T–2.56T resistance band with invalidation above it and position sizing adjusted to portfolio risk limits.
This analysis is for informational purposes only and does not constitute financial advice.