

TOTAL Marketcap / Crypto Total Market Cap
TOTAL weekly analysis week 6 February 2026. The TOTAL market cap index remains in a decisive bearish impulse, with our technical analysis focused on whether the latest support breakdown becomes a clean support resistance flip or a short-term fake-out reclaim.
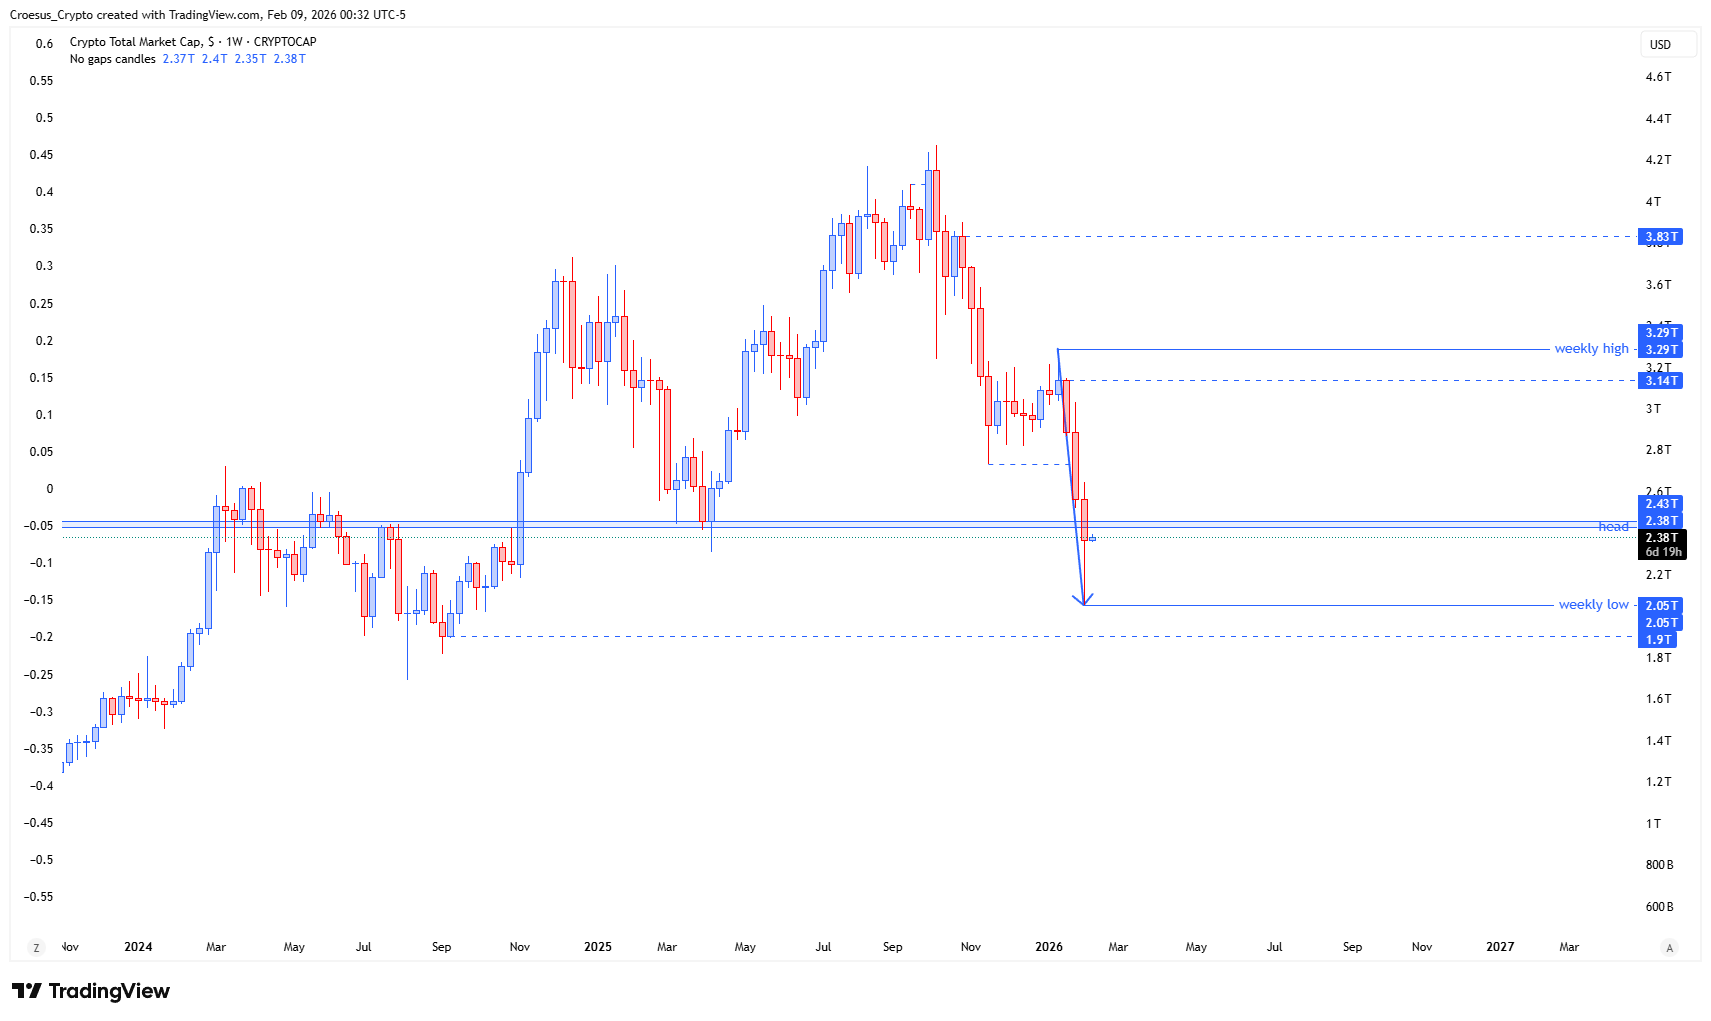
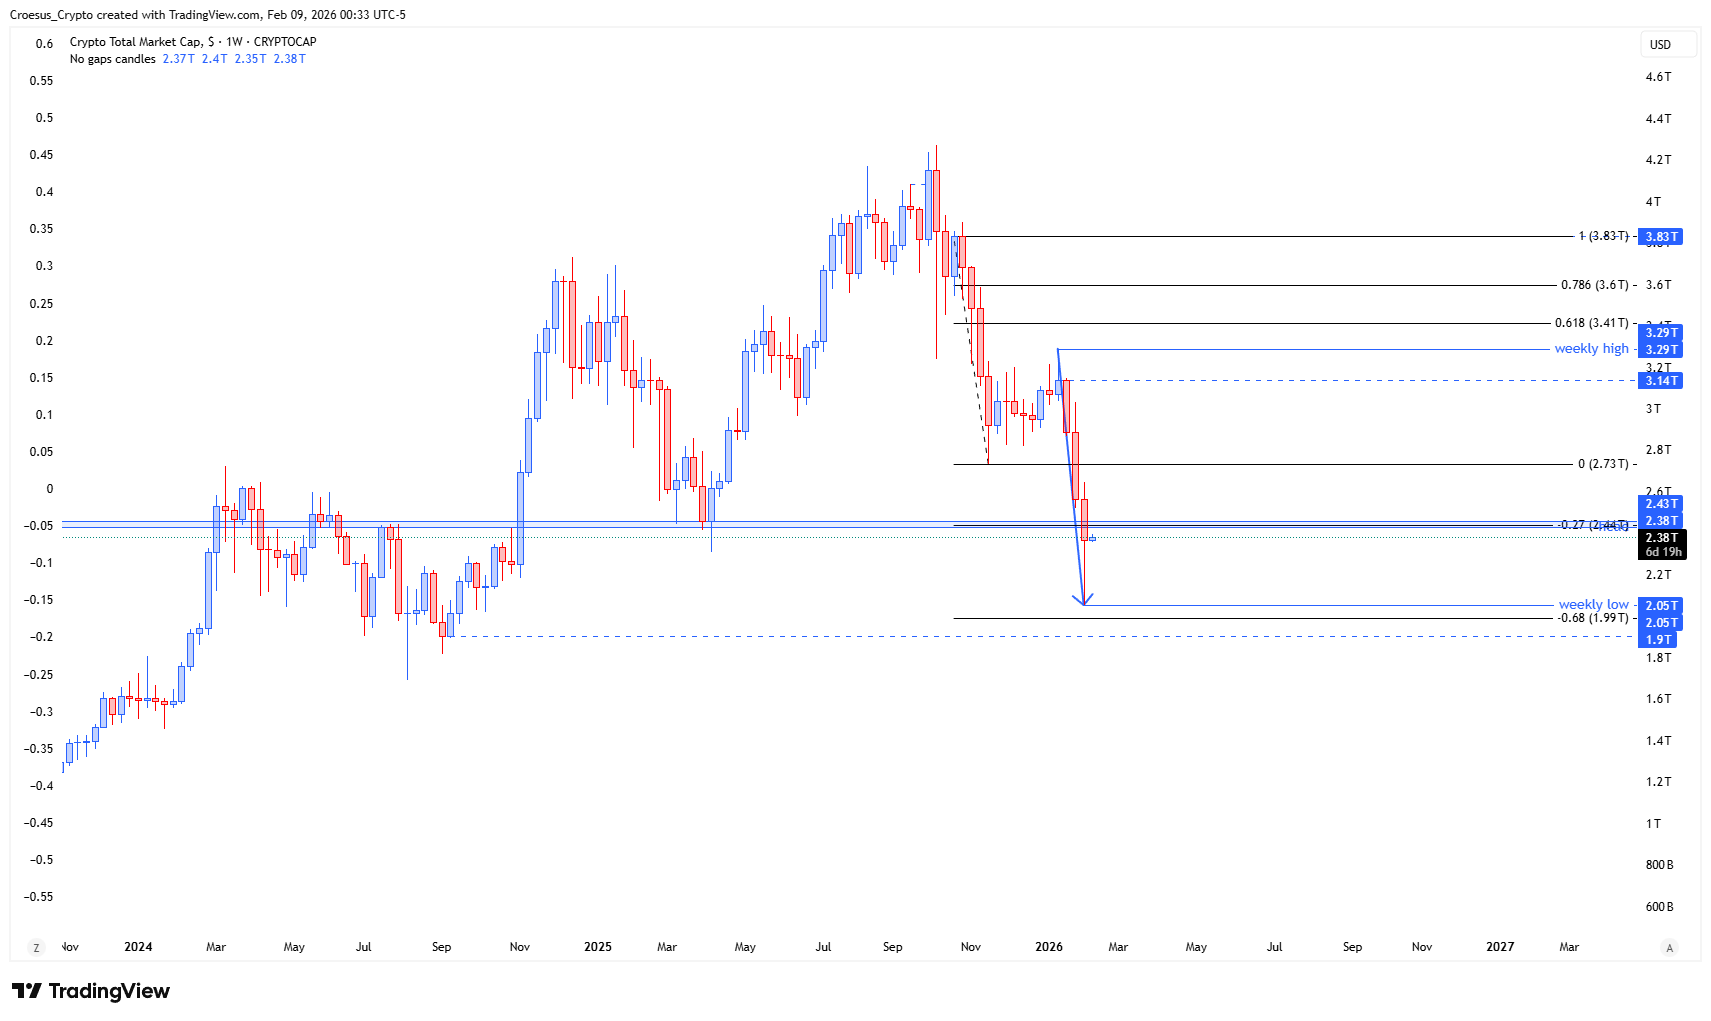
- After last weeks impulsive bearish continuation we saw the index continue further south, with an impulsive retest of the weekly larger shoulder level.
- But the index closed below one of the support levels. Question is if this level will be reclaimed shortly (fake-out) or will as resistance (losing support changes the level into resistance).
Market Structure Analysis
From a naked trading perspective, TOTAL weekly analysis shows bearish market structure staying intact: price continues to print lower lows with impulsive downside legs, followed by only limited corrective relief. The “impulsive retest of the weekly larger shoulder level” highlights that prior structure is acting as a magnet during trend continuation, which is typical in PHASE 4 where the impulse extends and weak supports give way quickly. The most important development is the weekly close below a support level, because closes matter more than intrawick breaks for confirming a breakdown.
Structurally, the next read is straightforward:
- if price reclaims that broken support and holds above it, the move can resolve as a fake-out and trap late sellers.
- If it fails to reclaim, that same zone is likely to act as resistance on any retest, keeping the bearish continuation bias in control.
Key Levels and Scenarios
For TOTAL weekly analysis, the bullish recovery scenario requires a reclaim and acceptance back above the recently lost support. The bearish continuation scenario remains favored if price retests that level from below and gets rejected, confirming the support-to-resistance flip and opening continuation toward lower structure.
- The weekly larger shoulder level as a major structural reference for acceptance vs rejection
- The recently broken support level as the key reclaim (fake-out) level or new resistance on retest
This analysis is for informational purposes only and does not constitute financial advice.