

Our TOTAL yearly analysis and 3M analysis for December 2025 focus on the 2025 swing failure at the all-time high and how the current quarterly structure is interacting with major support resistance and Fibonacci retracement levels. The macro picture remains constructive, but the market is clearly hunting liquidity around prior structures.
Technical Analysis Key Points
- as we also have a yearly close, we will be analyzing the yearly chart also.
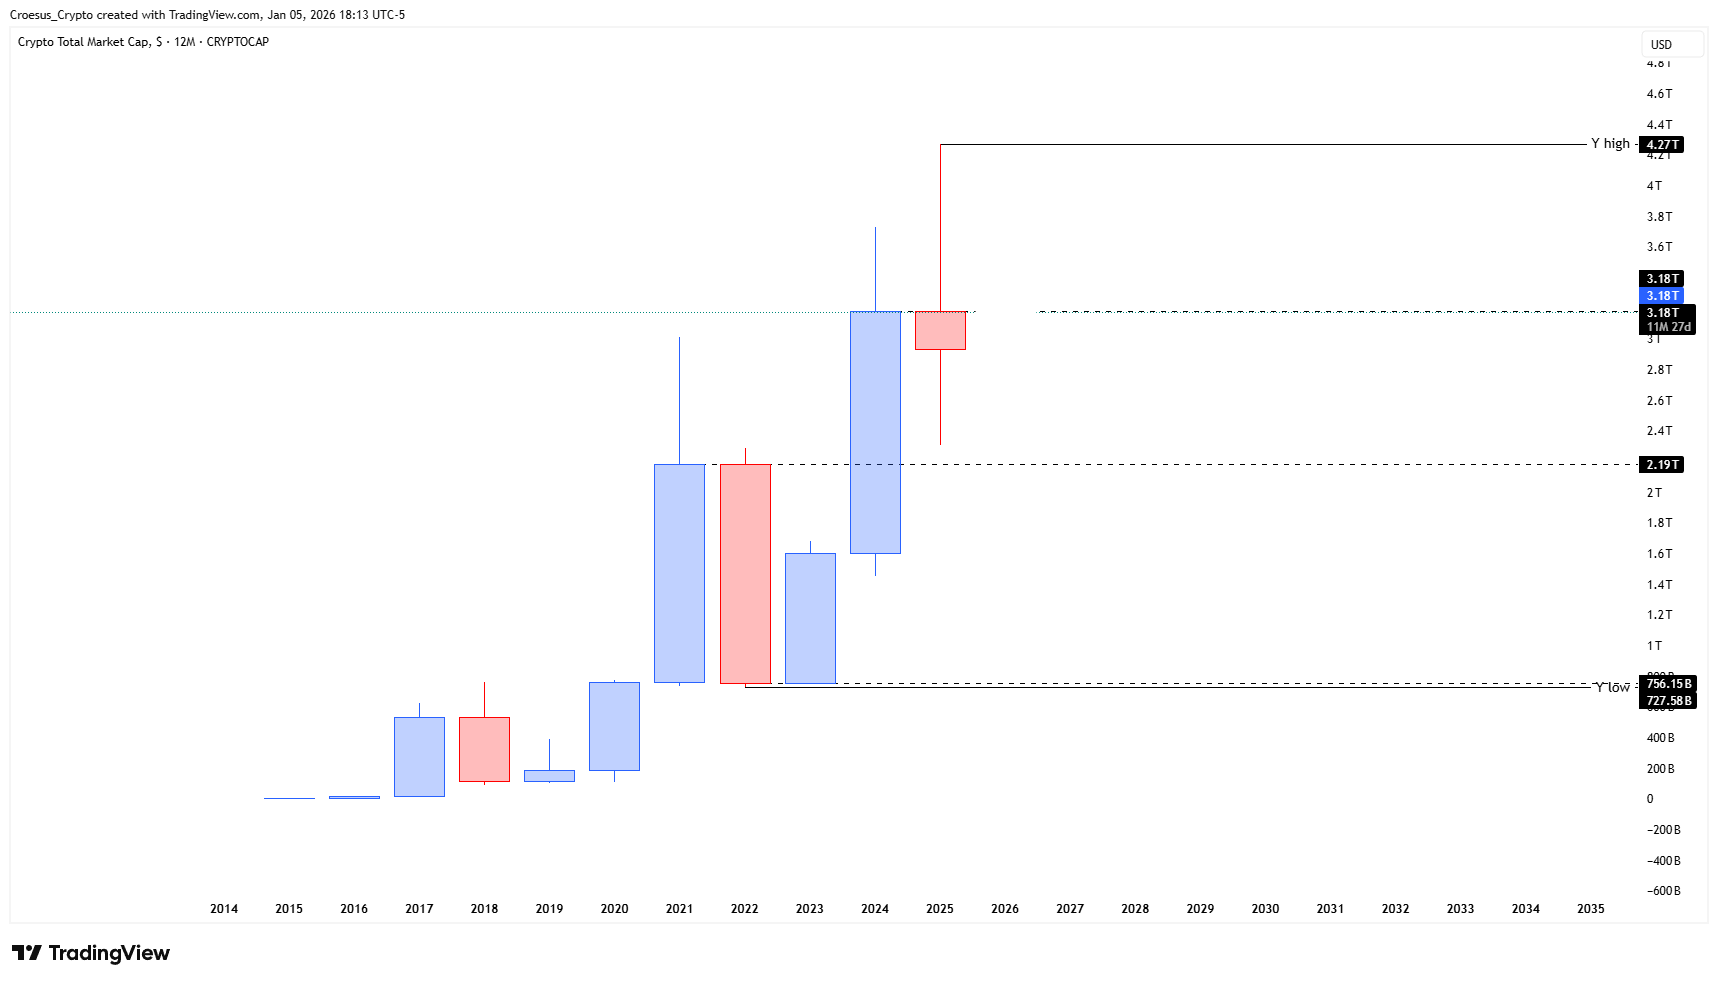
- We can see that TOTAL 2025 closed bearish, leaving with a swing failure pattern. First the index tried to retest the first structure at 2.19T, but did not touch it. In the second half we saw the index move higher creating a new all time high (ATH), but getting rejected and closing bearish.
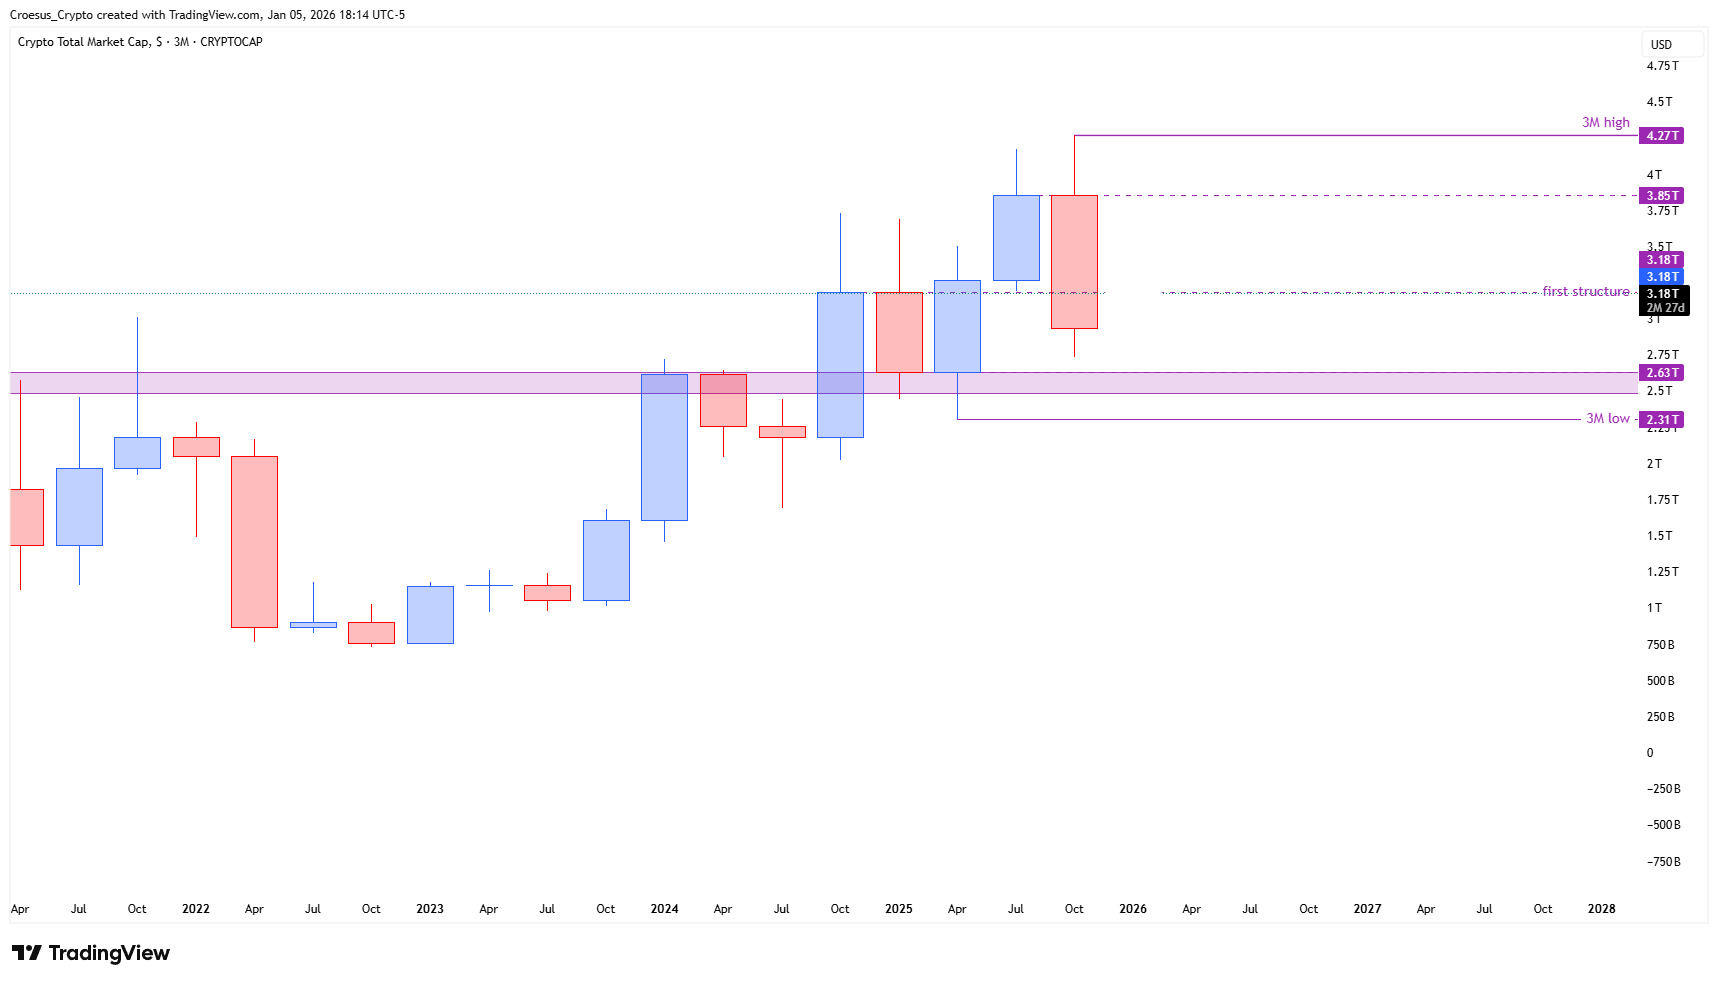
- If we zoom in on the 3M chart, we can see that we are still bullish but broke through the first structure. The index attempted to tap the fib retracement 100% (purple bar) but just failed.
- we can expect the 100% retracement to be tapped for more liquidity.
Market Structure Analysis
On the yearly timeframe, TOTAL 2025 printed a bearish candle with a clear swing failure pattern at the Y high near 4.27T. Price first pushed down, nearly revisiting the first structure around 2.19T, then reversed higher to set a fresh ATH before being rejected and closing back below the highs. This combination of failed downside tag and upside rejection shows strong two-sided liquidity but no decisive yearly breakout yet.
In our quarterly TOTAL analysis, the index remains in a broader bullish structure, trading above the 3M low zone but having already broken back through the first structure on the way down. The recent leg attempted to complete a full 100% Fibonacci retracement into the highlighted purple liquidity band but narrowly missed, suggesting that market makers may still want to revisit that area to fully clear resting orders before any sustained move higher.
Key Levels and Scenarios
Bullish scenario:
If the index dips into and holds the 100% Fibonacci retracement zone (purple bar), we expect liquidity to fuel a new leg toward the 3M high and potentially another attempt at the 4.27T Y high, confirming that the current move is corrective rather than a major trend reversal.
Key levels to watch:
4.27T Y high / ATH – main resistance; a yearly or 3M close above would confirm renewed macro strength.
3.18T area – current mid-range structure where reactions have been choppy.
100% Fibonacci retracement zone (purple bar) – likely liquidity pocket and potential bullish re-accumulation area.
2.19T first structure (yearly) – key support; a sustained break below would shift the macro bias to neutral or bearish.
Sub-1T Y low region – extreme downside reference in case of a deep cycle reset.
Trading Implications
For active traders, the cleaner R/R sits around the 100% retracement liquidity band and the 2.19T first structure, with invalidation placed below that support, while conservative participants may wait for a confirmed close back above 4.27T before positioning for a new cycle expansion.
This analysis is for educational purposes only and does not constitute financial advice; always do your own research and manage your risk carefully.